WORKING PAPER · PART 1 · FROM COAL-EQUIVALENT PLANTS TO A COAL-EQUIVALENT FLEET
Plant-Level Evidence for Firm Solar in India
Download Paper (PDF, 3.9 MB)
Contents39 sections
Summary
India’s solar-plus-storage component costs have fallen to the point where coal-equivalent round-the-clock clean power is achievable at a cost competitive with new coal and, over a 25-year contract, well below it. However, utilities continue to sign power purchase agreements for new coal plants, often arguing that renewable round-the-clock configurations do not deliver equivalent performance, are less reliable, and impose additional grid costs because they do not bear the full cost of transmission.
In this analysis, we estimate the 1 GW renewable round-the-clock configuration required to meet the same performance criteria defined by Central Electricity Regulatory Commission norms for coal plants: 85 percent annual availability at rated capacity and over 90 percent availability during peak demand months, with maintenance outages scheduled during off-peak periods. We further require that the renewable configuration pays the full cost of its transmission infrastructure.
We evaluate the configuration against a deliberately strict binary availability standard (full rated output or nothing in each hour) rather than the more forgiving partial-credit Demand Fulfilment Ratio used in actual tenders, so the coal-equivalence claim is not inflated by partial delivery.
We find that a co-located configuration comprising 5 GW AC of solar (7.0 GW DC at a 1.4:1 inverter loading ratio) paired with 16 GWh of battery storage behind a single 1 GW grid connection satisfies the coal-equivalent performance criteria with substantial margin across 10 major Indian states and union territories and 10 historical weather years.
We find that the configuration achieves a median annual availability of 90.7% across all modeled state-year combinations. This exceeds the 85% coal benchmark by nearly six percentage points. Importantly, every state in every simulated weather year clears the 85% annual availability threshold, indicating robustness to both geographic and interannual weather variability. In fact, we believe these results understate the achievable availability relative to real-world operation because we do not model any foresight, price arbitrage, peak-hour prioritization, or predictive charge scheduling.
Critically, reliability is highest when the grid needs it most. India’s peak electricity demand occurs between March and June, the same months when solar generation is strongest. During India’s March–June peak demand months, plant availability runs at 92–97 percent across states in March–May, easing in June as the monsoon begins (§5.1). During the top 10 percent of national demand hours, it exceeds 93 percent in 9 of 10 states, with Haryana the sole exception at 92.9 percent. The roughly 550 hours of annual shortfall concentrate in the opposite direction: 57 percent fall during monsoon months and 61 percent at nighttime, both periods of below-average demand. The plant is least available precisely when the grid is least stressed.
The coal fleet, by comparison, chronically fails to meet its own 85 percent norm: the national average plant availability factor is approximately 76 percent, with state-sector generating companies averaging only 75–80 percent. Coal failures (boiler tube leaks, coal supply disruptions, ash handling breakdowns) strike unpredictably and can last days to weeks. The RE-RTC configuration delivers higher availability than the coal fleet actually achieves, and its shortfalls are seasonal, forecastable, and concentrated in low-demand periods, unlike the abrupt boiler, fuel-supply, and electrical failures that drive coal outages.
At current costs, the plant-gate LCOE of the solar-plus-storage RTC configuration is INR 5.08/kWh after lifecycle accounting (state-of-charge reserve, forced-outage derating, panel augmentation, mid-life battery replacement; §5.3). This accounting includes a minimum state-of-charge reserve, equipment forced-outage derating on delivered energy, annual panel augmentation to offset 0.5 percent/yr solar degradation, and a mid-life battery cell replacement. The resulting LCOE falls below the entire new coal PPA range of INR 5.38–6.30/kWh, roughly 13 percent below its midpoint and 6 percent below its lower bound, under comparable availability requirements. If the RE-RTC plant is assumed to be located outside the procuring state and therefore subject to ISTS charges for delivery to the state boundary, the all-in delivered cost is INR 5.83/kWh, essentially at the midpoint of new coal’s bus-bar range, and below new coal once its own transmission cost is included. This comparison is conservative: coal TBCB tariffs are bus-bar generation costs that exclude ISTS transmission charges, whereas the RE-RTC all-in cost includes them. More importantly, the RE-RTC tariff is flat in nominal terms over the full 25-year PPA tenure. Coal tariffs, by contrast, include a variable / fuel cost component that escalates annually with domestic and/or imported coal prices, with the variable fuel component alone pushing the all-in tariff to roughly INR 6.4/kWh by year 10 (see §5.3).
Early RE-RTC tenders demonstrated competitive tariffs but did not resolve the two concerns that have prevented utilities from treating renewable firm power as a credible substitute for coal: geographically dispersed assets that diffuse accountability and complicate grid integration, and ISTS charge waivers that obscure the true delivered cost of transmission. The dramatic decline in battery storage costs, evident in recent solar-plus-storage auction tariffs of INR 2.70–3.53/kWh for 2 to 6 hours of co-located BESS (sized at roughly half the solar AC capacity), makes it possible to scale storage to 16 hours and co-locate it with solar at a single site, eliminating both problems simultaneously. The resulting configuration delivers coal-equivalent reliability at a flat, inflation-proof price for 25 years, removing the technical basis for continued new coal procurement.
1. Clean Firm Power Bids Have Witnessed Dramatic Cost Reduction in India
Over the past five years, India has accelerated the clean firm power procurement across three auction tracks: (i) Round-the-Clock (RTC), (ii) Firm and Dispatchable Renewable Energy (FDRE) / peak-supply tenders, and (iii) integrated solar-plus-storage configurations. Together, these bids demonstrate that renewable-based firm power is increasingly competitive with new coal on a tariff basis.This single-plant analysis is the first of a two-part study. A companion paper (Paliwal, Abhyankar & Phadke, 2026, Part 2: Geographic Diversification at Continental Scale) shows that a 120-plant fleet of the configuration analyzed here, distributed across 18 Indian states, delivers 99.2–100.0 percent hourly reliability against a 100 GW constant target and near-perfect reliability against India’s actual hourly demand shape. The 10 high-resource sites examined here are a strict subset of that 120-site fleet — one site per state, picked as the highest average DC capacity factor block among land- and transmission-screened candidates (see Appendix A.3). Read together, the two papers establish (i) that a single co-located plant can already match a coal plant’s NAPAF and (ii) that a fleet of such plants can match an entire coal fleet’s aggregate firmness.
1.1 RTC Auctions: Designed as Coal Equivalents
RTC tenders were explicitly structured to replicate a baseload power plant: a nearly flat MW output for all 8,760 hours, embedding coal-equivalence into the design and mirroring nearly 85% availability norm per the Central Electricity Regulatory Commission (CERC) tariff regulations, with penalties based on the Demand Fulfilment Ratio (DFR), the share of scheduled power a developer actually delivers (§3.1).
SECI has conducted four RTC tranches since 2020 (SECI, 2020–2023; SECI, 2025), progressively tightening availability norms, as summarized in Table 1.
Table 1: Summary of SECI’s RTC auctions
| Tender | Tendered MW | Awarded Capacity | Tariff (INR/kWh) | Winners | Date | Key requirement |
|---|---|---|---|---|---|---|
| RTC-I | 400 | 400 MW | 2.90 (yr 1, 3% escalation; levelised approximately 3.60/kWh at 10% disc) | ReNew | May 2020 | RE + optional ESS; 80% annual, 70% monthly |
| RTC-II | 2,500 | 2,500 MW | 3.01 | Hindustan Thermal (L1, 250 MW) | Oct 2021 | RE + thermal or storage; 85% annual, 85% peak; 51% RE minimum |
| RTC-III | 2,250 | Unawarded | N/A | — | 2022-23 | 90% annual, 90% monthly, 90% peak |
| RTC-IV | 1,200 | 420 MW | 5.06–5.07 | Hero Solar, Hexa Climate, Jindal, Sembcorp | May 2025 | RE + mandatory ESS; 80% annual DFR, 75% monthly DFR, 90% peak DFR |
Tendered figures from SECI RfS documents (post-amendment where applicable); awarded reflects L1+L2 bid outcomes. Differences indicate severe undersubscription: RTC-III drew no award and RTC-IV awarded only 35 percent of 1,200 MW. RTC-II’s full 2,500 MW was allotted (originally tendered at 5,000 MW), with Hindustan Thermal Projects the L1 bidder for a 250 MW slice at INR 3.01/kWh.
RTC-IV imposed the strictest peak obligation (90% DFR during peak blocks) and discovered tariffs of INR 5.06–5.07/kWh. Even at RTC-IV’s INR 5.06–5.07/kWh, the highest of the four tranches and the only awarded tender carrying a 90 percent peak-hour DFR obligation, tariffs are comparable to or below new coal PPAs signed in 2025 (INR 5.38–6.30/kWh first-year, escalating with coal prices1).
1.2 FDRE and Peak Supply Bids
[Proposed condensation of this subsection to the paragraph below; the green table and prose that follow would be deleted.]
SECI’s parallel FDRE track (2024–2026) required demand-following or peak-hour delivery rather than flat 24/7 output; awarded tariffs ranged from INR 4.98/kWh (FDRE-IV, demand-following, 630 MW) to INR 8.50/kWh (FDRE-VI, 4-hour peak supply, 200 MW of 2,000 MW tendered), with FDRE-II (480 MW at INR 5.59/kWh) cancelled after award and FDRE-VII (Feb 2026) the one fully subscribed tranche, awarding its full 1,200 MW at INR 6.27/kWh (SECI tender documents and CERC tariff adoption orders, 2024–2026). These are distinct products from RTC’s flat-block obligation — FDRE-IV’s INR 4.98/kWh should not be confused with RTC-IV’s 5.06–5.07 — and, FDRE-VII aside, they faced the same DFR-flexibility and undersubscription concerns as the RTC track.
FDRE tenders required developers to follow demand profiles or guarantee peak-hour supply but were not designed to provide flat 24/7 output. Table 2 summarizes the FDRE bids concluded so far.
Table 2: Summary of the concluded FDRE bids in India
| Tender | Tendered MW | Capacity awarded | Model | DFR requirement | Date | L1 tariff |
|---|---|---|---|---|---|---|
| FDRE-II | 1,500 | 480 MW (later cancelled) | Demand-following | 90% monthly | Mar 2024 | INR 5.59/kWh |
| FDRE-IV | 1,260 | 630 MW | Demand-following | 80% monthly (relaxed) | Jul 25, 2024 | INR 4.98/kWh |
| FDRE-VI | 2,000 | 200 MW | Peak supply (4 hrs) | 4 MWh/MW/day during peak hours | Jan 2025 | INR 8.50/kWh |
| FDRE-VII | 1,200 | 1,200 MW | Peak supply (4 hrs) | 70% monthly, 85% annual | Feb 5, 2026 | INR 6.27/kWh |
Tendered figures from SECI RfS documents; FDRE-VI saw only 200 MW awarded of 2,000 MW tendered (10% award rate); FDRE-II was fully cancelled in Jun 2024 even after the 480 MW award.
Source: SECI tender documents and CERC tariff adoption orders, 2024–2026.
Note: RTC-IV (Table 1) and FDRE-IV (Table 2) are distinct tenders with different product structures — RTC-IV requires flat 24/7 output, FDRE-IV requires demand-following dispatch. The lower 4.98/kWh FDRE-IV L1 should not be confused with the RTC-IV 5.06–5.07/kWh range.
FDRE auctions also faced similar limitations as RTC, especially in terms of flexible demand fulfillment ratio.
1.3 Solar-Plus-Storage: Rapid Cost Decline
The third track, integrated, co-located solar-plus-storage, has delivered dramatic tariff reductions. A select few solar + co-located storage bid results are summarized in Table 3.
Table 3: A few notable solar + co-located storage bids in India
| Tender | Solar (MW-AC) | BESS (MW / MWh) | BESS Duration (hr) | Tariff (INR/kWh) | Date |
|---|---|---|---|---|---|
| SECI Solar+BESS (Tr. XVII) | 2,000 | 1,000 / 4,000 | 4 | 3.52–3.53 | Dec 2024 |
| RUMSL Solar+BESS (Morena) | 600 | 440 / 880 (220 / 440 per developer) | 2 | 2.70–2.76 | Sep 2025 |
| SECI Solar+BESS (ISTS-XX) | 2,000 | 1,000 / 4,000 | 4 | 2.86–2.87 | Oct 2025 |
| SECI Solar+BESS (1.2 GW) | 1,200 | 600 / 3,600 | 6 | 3.12–3.13 | Jan 2026 |
Source: SECI and RUMSL auction results, 2024–2026.
These tenders shift daytime solar into the evening or early-morning peak using co-located batteries. The BESS is typically sized at half the solar AC capacity, so the 2 to 6 hours of storage in Table 3 refers to discharge at the battery’s rated power (equivalent to roughly 1.5 to 3 hours relative to solar AC). These projects still do not offer RTC support.
What these auctions do reveal is that solar and battery component costs have reached a threshold where a natural question arises: if 2 to 6 hours of co-located BESS (at the battery’s rated power) bundled with solar delivers tariffs near INR 3/kWh, what does it cost to build enough storage to deliver true round-the-clock power? And can such a configuration match the reliability that coal provides?
2. Why do utilities continue to procure new coal when RE-RTC tariffs are lower?
Despite a dramatic reduction in RE-RTC as well as peak supply / solar-plus-storage tariffs, utilities continue to sign long-term coal power purchase agreements (PPAs). In 2025 alone, West Bengal signed a 25-year PPA for 1.6 GW of new coal (JSW Energy, Salboni), Madhya Pradesh issued letters of award for 4.0 GW (Torrent Power 1.6 GW, Adani Power 1.6 GW at Anuppur, and Hindustan Thermal Projects 0.8 GW at Anuppur Phase II), Bihar secured a further 2.4 GW (Adani Power), Uttar Pradesh signed a 1.5 GW PPA (Adani Power, Mirzapur), and Assam awarded 3.2 GW (Adani Power) (based on publicly reported PPA signings and letters of award, 2024–2025). These commitments lock utilities into 25-year fuel-cost exposure at first-year tariffs of INR 5.38–6.30/kWh (per recent TBCB outcomes; see Appendix A.7) that escalate annually with coal prices.
We believe the explanation for this lies in the credibility gap. Coal plants are single-site, single-fuel assets with decades of operational history. When a coal plant is granted connectivity, system planners can count on a defined MW quantum at a known location with clear accountability: single plant, single node, and a predictable / schedulable set of outages (maintenance only, excluding forced outages). This makes coal a default choice for capacity adequacy planning, even when its actual availability falls short of norms. RE-RTC configurations have not yet earned equivalent planning credibility, primarily because of the DFR flexibility as well as system integration, operational, and execution concerns summarized in this section.
2.1 Reliability and Design Limitations
Early RTC tenders permitted meaningful flexibility in delivery. RTC-I required 80% annual and 70% monthly capacity utilization factor (CUF) without mandating a flat profile, allowing over-delivery during high-solar hours and under-delivery during peak demand periods, without providing the firm capacity that system planners need. Later tranches tightened peak-hour DFR thresholds to 85–90 percent. Even in RTC-IV, which imposed a 90% peak DFR requirement, availability outside designated peak blocks could fall substantially lower. From a system-planning perspective, this introduces residual uncertainty relative to conventional thermal assets.
2.2 Asset Dispersion and Operational Complexity
Coal plants are single-site, single-fuel assets with centralized accountability. Once connected, planners can attribute performance to one owner at one node with transparent outage records. In contrast to coal’s single-node accountability, most RTC configurations aggregate geographically dispersed assets. For example, ReNew Power’s RTC-I combines solar and storage in Rajasthan with wind assets across Karnataka and Maharashtra. Similarly, Greenko’s winning bid under the SECI Peak Power tender integrates dispersed solar and wind generation with a large pumped hydro facility in Andhra Pradesh. Injection across multiple states and load dispatch centers diffuses accountability. When shortfalls occur, causality is not easily attributable, whether due to wind variability, curtailment, transmission constraints, or storage outages. This complexity reduces planning confidence, even if contractual penalties exist.
2.3 The Transmission Cost Distortion
Beyond project-level credibility, there is the question of whether RE-RTC projects bear their full cost of transmission. ISTS charge waivers for renewable energy projects were first introduced under the CERC Sharing Regulations in 2010–11, and significantly expanded by the Ministry of Power in 2016 to cover both solar and wind projects (MoP, 2016; MoP, 2021). ISTS waivers for renewables (MoP, 2016; MoP, 2021) are now being phased out, falling to zero for projects commissioned after June 2028.
Several early SECI round-the-clock tenders were structured using geographically dispersed solar, wind, and battery assets that benefited from full ISTS waivers. When solar and wind projects operate at AC capacity factors of around 25 percent, the levelized transmission cost per delivered kilowatt-hour is high because the network is underutilized relative to its rated capacity. If these charges are waived or socialized, the effective per-unit transmission cost faced by such projects is substantially below the true cost of infrastructure.
In contrast, coal plants typically operate at capacity factors of roughly 65 to 75 percent (CEA, FY24–FY25 all-India coal PLF approximately 69–70 percent) and pay applicable ISTS charges. With higher utilization of transmission assets, their effective transmission cost per delivered unit is correspondingly lower, often below INR 1 per kWh on a levelized basis. Until RE-RTC projects bear comparable transmission costs, tariff comparisons between coal and renewables remain incomplete.
2.4 Execution Track Record
Commissioning delays have reinforced skepticism. RTC-I experienced significant slippages relative to contracted timelines, and large-scale pumped hydro components under RTC-II achieved phased commissioning well beyond initial targets. As of early 2026, no fully integrated utility-scale RTC project has demonstrated sustained operation at contracted reliability levels. For system planners, demonstrated performance matters more than modeled compliance.
These concerns have tangible consequences. Approximately 8 GW of SECI-procured renewable firm capacity (between RTC and FDRE tenders) remains unsigned (SECI, 2025). Meanwhile, utilities continue signing long-term (typically, 25 years) coal PPAs to meet the resource adequacy requirement, which requires 75 percent of peak demand to be met through long-term firm contracts (MoP, 2023).
The objective of this paper is to test whether a co-located solar-plus-storage configuration, scaling storage well beyond current auction norms to 16 hours, can deliver coal-equivalent availability when evaluated against the same CERC norms applied to coal plants, with full transmission costs and no waivers. Our previous analysis, using a comparable solar-to-storage ratio, estimated flat block 24/7 clean power (at 90-95% availability) at INR 4.0–4.6/kWh (Chojkiewicz, Abhyankar, and Phadke, 2025). Our analysis confirms these findings and extends them by demonstrating that the configuration meets coal’s own reliability standards with substantial margin, at a flat nominal price for 25 years.
3. Designing coal-equivalent RE-RTC
Co-location at a single site provides the same accountability structure as a coal plant: single node and grid connection. Scaling storage to 16 hours enables continuous delivery across the full diurnal cycle. And requiring full GNA-based transmission charges eliminates the transmission cost opacity that undermines tariff comparisons. For a co-located, 16-hour-storage configuration to be credibly coal-equivalent, it must meet two tests: the same availability standards applied to coal, and the same transmission cost obligations.
3.1 85% Availability criteria
Under the CERC Terms and Conditions of Tariff Regulations, 2024–29, coal-based generating stations are governed by a Normative Annual Plant Availability Factor (NAPAF) of 85 percent (CERC, 2024). NAPAF represents the percentage of time a unit is expected to be available to generate electricity over the year, after accounting for all forced and planned outages. An 85 percent NAPAF therefore implies that total outages are limited to about 15 percent of the year.
To establish coal equivalence in renewable round-the-clock tenders, performance requirements should mirror this benchmark. Specifically, solar-plus-storage configurations should be required to deliver full rated capacity for at least 85 percent of hours annually, at least 90 percent of hours during peak demand months (March through June), and no less than 70 percent of hours in any off-peak month, consistent with coal plants’ scheduling of planned maintenance during off-peak periods.
This availability metric is deliberately stricter than the Demand Fulfilment Ratio (DFR) used in existing RTC and FDRE tenders. Under DFR, an hour where the plant delivers 0.95 GW against a 1 GW schedule contributes 95 percent toward compliance. Under the binary availability standard used here, that same hour counts as zero: the plant either delivers full rated capacity or it does not. This conservative choice ensures that coal-equivalence claims are not inflated by partial delivery.
3.2 Transmission cost internalization
Under the CERC’s General Network Access (GNA) framework (CERC, 2022), ISTS transmission charges are levied on a capacity basis (INR per MW per month), not on a volumetric energy basis, regardless of how much energy is actually scheduled. Rates are computed monthly through the Point of Connection (PoC) mechanism (CERC, 2020) and generally range from INR 3 to 5 lakh per MW per month under the current GNA regime (Feb 2026: approximately INR 3.6 lakh; the earlier INR 4–6 lakh band reflects the pre-GNA 2020–23 regime), varying by state and month.
For analytical parity with coal generation, RE-RTC configurations should be required to pay the applicable GNA-based transmission charge on an INR per MW per month basis. This internalizes network infrastructure costs in the bid tariff and creates a natural incentive for co-location behind a single grid connection: a co-located plant contracts GNA once for its rated output, whereas geographically dispersed assets must each reserve separate network capacity, raising total transmission costs significantly. Requiring full transmission cost recovery ensures that RE-RTC bids reflect the true system cost of delivering firm, coal-equivalent capacity.
4. Approach
We test whether a single co-located, DC-coupled solar-plus-storage plant can meet coal-equivalent availability standards at the individual site level. We simulate one plant in each of 10 states across 10 weather years (2015–2024), yielding 100 site-year scenarios.
Configuration. To ensure conservative results, dispatch is modeled as strictly myopic and rule-based, with no forecasting, intertemporal optimization, or market-responsive behavior. The plant prioritizes delivery of the 1 GW target every hour.The solar array is sized at 5 GW AC (7 GW DC at the 1.4:1 ILR), five times the grid output, and is DC-coupled to a battery with 16 GWh of usable energy (17.78 GWh nameplate above a 10 percent minimum state-of-charge reserve; Appendix A.2). The five-fold oversizing provides the daily energy margin needed to charge that battery for overnight discharge.
No foresight, price arbitrage, peak-hour prioritization, or predictive charge scheduling is permitted. In practice, an operator would allocate energy strategically. For example, an operator might conserve charge during low-solar days to ensure compliance during high-value evening peak periods. Such behavior would likely improve reliability under peak-based DFR requirements. By excluding these operational strategies, the model intentionally understates achievable availability relative to real-world operation.
Each configuration is evaluated against a coal-equivalent reliability benchmark. Specifically, the plant must deliver full rated capacity (1 GW) for:
- At least 85% of hours annually;
- At least 90% of hours during peak demand months (March through June); and
- At least 70% of hours in any off-peak month, consistent with coal plants’ practice of scheduling planned maintenance during lower-demand periods.
Only configurations that satisfy all three criteria are considered coal-equivalent in availability.
Evaluation criteria. Each configuration is evaluated against the three coal-equivalent availability criteria defined in §3.1 and formalized in Appendix A.1; a configuration is coal-equivalent in availability only if it meets all three simultaneously.
Solar data and sites. Hourly solar capacity factors (CFs) are drawn from NREL’s reV/ReEDS-India utility-scale PV dataset (fixed-tilt modules, 1.4:1 ILR; underlying irradiance from NSRDB-India) (NREL, 2024), covering 157,715 grid cells in India at approximately 5 km resolution for weather years 2015 through 2024. We select one representative high-capacity factor site per state, selected from land- and transmission-screened candidate locations (Appendix A.3) as summarized in Table 4:
Table 4: DC-basis solar capacity factors of the selected sites (one site in each state) used in this analysis. Values are annual AC energy output per unit of installed DC module capacity (fixed-tilt array at a 1.4:1 ILR); on an AC-nameplate basis the same sites are about 1.4 times higher, roughly 23–29 percent. Site selection was anchored on the 2015 supply-curve dataset shown here; the 10-year (2015–2024) simulated mean across these sites is approximately 17.4 percent, within 0.2 percentage points of the table average.
| State | Avg DC CF (%) |
|---|---|
| Jammu and Kashmir | 21.0 |
| Gujarat | 18.1 |
| Rajasthan | 17.9 |
| Tamil Nadu | 17.5 |
| Karnataka | 17.3 |
| Andhra Pradesh | 17.2 |
| Madhya Pradesh | 16.9 |
| Maharashtra | 16.8 |
| Telangana | 16.7 |
| Haryana | 16.6 |
Note: These are DC-basis capacity factors (AC energy output per unit of installed DC nameplate) for a fixed-tilt array at a 1.4:1 ILR, so the hourly profile saturates at 1/1.4 = 0.714 (full 5 GW-AC output) on clear days; on an AC-nameplate basis the same sites are about 1.4 times higher, roughly 23–29 percent, consistent with the around 25 percent AC capacity factor cited in Section 2.3. The values shown are from the 2015 supply-curve dataset that anchored site selection; the 10-year (2015–2024) H5-derived mean across the 10 selected sites is approximately 17.4 percent (DC basis), within 0.2 percentage points of the table average.
Equipment derating. Weather simulations do not capture equipment forced outages. We apply a 3 percent equipment derating as a realistic central case (5 percent as a conservative bound) (Appendix A.6). All availability figures presented in this paper are directly comparable to coal plant performance, which inherently includes equipment outages.
Costs. Our cost assumptions — solar and battery capex, fixed O and M, WACC, project life, ISTS charges, and the new-coal PPA benchmark — are summarized in Table A1 of Appendix A.5.
Table 5: Key cost assumptions
| Parameter | Value | Source / Rationale |
|---|---|---|
| Solar capex | INR 3.75 crore/MW-AC | Industry reported values of INR 3.5–4 Cr/MW and Chojkiewicz et al. (2025) |
| Battery capex | INR 7,280/kWh (DC-coupled co-located system) | Engineering build-up: LFP pack about INR 4,550–5,460/kWh (BNEF 2025) plus DC-coupled BOS, EPC and integration; well below standalone India BESS (INR 10,920–13,195/kWh). Corroborated by (not derived from) recent auctions (Chojkiewicz et al., 2025) |
| Fixed O and M cost | 1.5% of project capex/yr | Industry norms; consistent with O&M components in recent SECI/NTPC RE-RTC and BESS tender documents and with CEA norms for utility-scale solar (approximately INR 5–7 lakh/MW/yr) |
| Weighted Average Cost of Capital (WACC) | 10% (nominal) | Using debt:equity ratio of 80:20 with ROE of 14% and debt cost of 9% |
| Project life | 25 years | Typical PPA tenure in India |
| ISTS transmission charges, including losses | INR 0.50–1.00/kWh (equivalent to INR 3.36 to 6.73 lakh/MW/month at the modeled plant load factor) | Derived from LT-GNA charges of INR 3 to 5 lakh/MW/month (Feb 2026: approximately INR 3.6 lakh) under the PoC mechanism (Grid-India, 2026); range envelopes state-by-state PoC variation and a conservative bound for future indexation |
| New coal PPA prices (for benchmarking) | INR 5.38–6.30/kWh | Range of first-year bus-bar tariffs from recent state TBCB PPAs (see Appendix A.7); excludes ISTS transmission |
All costs are expressed as nominal values, directly comparable to nominal PPA tariffs. Detailed methodology and cost assumptions are provided in Appendix A.
5. Results
Each plant is simulated independently at the site level across all 10 weather years, yielding 100 site-year scenarios. We organize the findings around three questions: Does it meet coal-equivalent availability, and when do the shortfalls occur (Section 5.1)? How does this compare to the coal fleet’s actual track record (Section 5.2)? And what does it cost (Section 5.3)?
5.1 Plant availability across 10 states
Figure 1 shows the annual plant availability for each state-year combination.
Every state clears the 85% coal norm in every weather year
Annual availability by state and weather year · 10 states × 2015–2024 · % of hours at rated output
UC BERKELEY ANALYSIS · AUGUST 2026
View the data table
% of hours at or above the 1 GW target. Every value is measured after a 3% equipment derate; a site-year passes only if it clears 85% for the year, 90% in its peak month and 70% in its worst month.
| State | Weather year | Availability (%) | Against the norm |
|---|---|---|---|
| Andhra Pradesh | 2015 | 91.16 | Fails |
| Andhra Pradesh | 2016 | 91.66 | Passes |
| Andhra Pradesh | 2017 | 90.09 | Passes |
| Andhra Pradesh | 2018 | 91.99 | Passes |
| Andhra Pradesh | 2019 | 90.46 | Passes |
| Andhra Pradesh | 2020 | 87.29 | Passes |
| Andhra Pradesh | 2021 | 88.3 | Fails |
| Andhra Pradesh | 2022 | 88.73 | Passes |
| Andhra Pradesh | 2023 | 90.84 | Passes |
| Andhra Pradesh | 2024 | 88.66 | Passes |
| Gujarat | 2015 | 94.08 | Passes |
| Gujarat | 2016 | 92.51 | Passes |
| Gujarat | 2017 | 91.66 | Fails |
| Gujarat | 2018 | 92.72 | Passes |
| Gujarat | 2019 | 91.43 | Passes |
| Gujarat | 2020 | 92.79 | Passes |
| Gujarat | 2021 | 91.04 | Passes |
| Gujarat | 2022 | 93.26 | Passes |
| Gujarat | 2023 | 92.24 | Passes |
| Gujarat | 2024 | 91.93 | Passes |
| Haryana | 2015 | 88.69 | Fails |
| Haryana | 2016 | 90.8 | Passes |
| Haryana | 2017 | 90.53 | Passes |
| Haryana | 2018 | 90.48 | Passes |
| Haryana | 2019 | 88.41 | Passes |
| Haryana | 2020 | 90.66 | Passes |
| Haryana | 2021 | 88.08 | Passes |
| Haryana | 2022 | 88.63 | Fails |
| Haryana | 2023 | 88.97 | Passes |
| Haryana | 2024 | 87.31 | Fails |
| Jammu & Kashmir | 2015 | 93.56 | Passes |
| Jammu & Kashmir | 2016 | 94.44 | Passes |
| Jammu & Kashmir | 2017 | 93.88 | Passes |
| Jammu & Kashmir | 2018 | 94.67 | Passes |
| Jammu & Kashmir | 2019 | 94.62 | Passes |
| Jammu & Kashmir | 2020 | 93.98 | Passes |
| Jammu & Kashmir | 2021 | 94.05 | Passes |
| Jammu & Kashmir | 2022 | 94.75 | Passes |
| Jammu & Kashmir | 2023 | 93.51 | Passes |
| Jammu & Kashmir | 2024 | 94.39 | Passes |
| Karnataka | 2015 | 92.28 | Passes |
| Karnataka | 2016 | 90.11 | Passes |
| Karnataka | 2017 | 91.34 | Passes |
| Karnataka | 2018 | 90.68 | Passes |
| Karnataka | 2019 | 89.13 | Passes |
| Karnataka | 2020 | 88.57 | Fails |
| Karnataka | 2021 | 88.92 | Passes |
| Karnataka | 2022 | 88.48 | Fails |
| Karnataka | 2023 | 91.15 | Fails |
| Karnataka | 2024 | 88.71 | Fails |
| Madhya Pradesh | 2015 | 89.51 | Passes |
| Madhya Pradesh | 2016 | 91.49 | Passes |
| Madhya Pradesh | 2017 | 91.64 | Passes |
| Madhya Pradesh | 2018 | 90.45 | Fails |
| Madhya Pradesh | 2019 | 87.53 | Passes |
| Madhya Pradesh | 2020 | 90.37 | Fails |
| Madhya Pradesh | 2021 | 88.65 | Passes |
| Madhya Pradesh | 2022 | 90.48 | Passes |
| Madhya Pradesh | 2023 | 89.98 | Passes |
| Madhya Pradesh | 2024 | 89.73 | Passes |
| Maharashtra | 2015 | 90.52 | Passes |
| Maharashtra | 2016 | 91.36 | Passes |
| Maharashtra | 2017 | 91.36 | Passes |
| Maharashtra | 2018 | 88.55 | Fails |
| Maharashtra | 2019 | 88.49 | Passes |
| Maharashtra | 2020 | 87.89 | Fails |
| Maharashtra | 2021 | 89.5 | Passes |
| Maharashtra | 2022 | 90.04 | Fails |
| Maharashtra | 2023 | 88.35 | Passes |
| Maharashtra | 2024 | 89.28 | Passes |
| Rajasthan | 2015 | 93.72 | Passes |
| Rajasthan | 2016 | 93.92 | Passes |
| Rajasthan | 2017 | 92.66 | Passes |
| Rajasthan | 2018 | 93.79 | Passes |
| Rajasthan | 2019 | 91.87 | Passes |
| Rajasthan | 2020 | 93.26 | Passes |
| Rajasthan | 2021 | 93.09 | Passes |
| Rajasthan | 2022 | 93.15 | Passes |
| Rajasthan | 2023 | 93.82 | Passes |
| Rajasthan | 2024 | 92.94 | Passes |
| Tamil Nadu | 2015 | 91.38 | Passes |
| Tamil Nadu | 2016 | 92.74 | Passes |
| Tamil Nadu | 2017 | 91.56 | Passes |
| Tamil Nadu | 2018 | 92.44 | Passes |
| Tamil Nadu | 2019 | 93.51 | Passes |
| Tamil Nadu | 2020 | 90.64 | Passes |
| Tamil Nadu | 2021 | 89.65 | Fails |
| Tamil Nadu | 2022 | 90.38 | Passes |
| Tamil Nadu | 2023 | 90.77 | Passes |
| Tamil Nadu | 2024 | 90.08 | Passes |
| Telangana | 2015 | 90.72 | Fails |
| Telangana | 2016 | 90.32 | Passes |
| Telangana | 2017 | 90.67 | Passes |
| Telangana | 2018 | 89.39 | Passes |
| Telangana | 2019 | 90.5 | Passes |
| Telangana | 2020 | 89.52 | Fails |
| Telangana | 2021 | 89.44 | Passes |
| Telangana | 2022 | 89.49 | Passes |
| Telangana | 2023 | 89.46 | Passes |
| Telangana | 2024 | 88.93 | Passes |
All 100 site-years exceed 85 percent annual plant availability. The minimum across the entire matrix is 87.3 percent (Andhra Pradesh, 2020) and the maximum is 94.7 percent (Jammu and Kashmir, 2022). The median plant availability across all 100 site-years, after applying the 3 percent equipment forced-outage derating, is 90.7 percent (the underlying weather-only median is 93.5 percent; see Appendix A.6). Jammu and Kashmir leads at 94.2 percent mean plant availability; Haryana is the lowest at 89.3 percent. No state fails the annual criterion in any year.
Applying all three coal-equivalent criteria simultaneously (annual >= 85%, peak season >= 90%, worst month >= 70%, all equipment-adjusted), 82 of 100 site-years pass. Jammu and Kashmir and Rajasthan pass in all 10 weather years. Gujarat and Tamil Nadu pass in 9 of 10 years, each falling short in a single year due to one month (Gujarat in July, Tamil Nadu in November) below the 70 percent floor. Andhra Pradesh, Madhya Pradesh, and Telangana each pass in 8 of 10 years; Haryana and Maharashtra in 7 of 10; and Karnataka in 6 of 10. No state ever fails on the annual availability criterion; every site-year exceeds 85 percent. Where the combined test is not met, the binding constraint is the worst-month floor: monsoon months (typically July or August) where equipment-adjusted availability falls to 65–70 percent, with the worst monsoon month being Maharashtra August 2020 at 64.7 percent, against the 70 percent threshold, or winter months at northern sites such as Haryana. As mentioned earlier, we assume no foresight, price arbitrage, peak-hour prioritization, or predictive charge scheduling. In practice, an operator would allocate energy strategically and would narrow these gaps further, especially during peak periods.
The strictness of the binary availability metric is evident when compared to the Demand Fulfilment Ratio used in RTC tenders. Under DFR, where partial delivery receives proportional credit, 97 of 100 site-years pass all three criteria, compared to 82 under binary availability. Gujarat’s single failing year (2017, July availability of 68 percent under binary, weather-only) achieves a DFR of 74 percent for that month, clearing the threshold. Tamil Nadu’s failing year (2021, November at 70 percent under binary, weather-only) similarly clears at 74 percent DFR. Of the 18 site-years that fail the binary test, 15 would pass under DFR: all states then pass in every weather year except Andhra Pradesh (9 of 10, failing in 2021) and Haryana (8 of 10, both failures on the January worst-month criterion: 2022 and 2024). The results presented throughout this paper use the stricter binary standard.
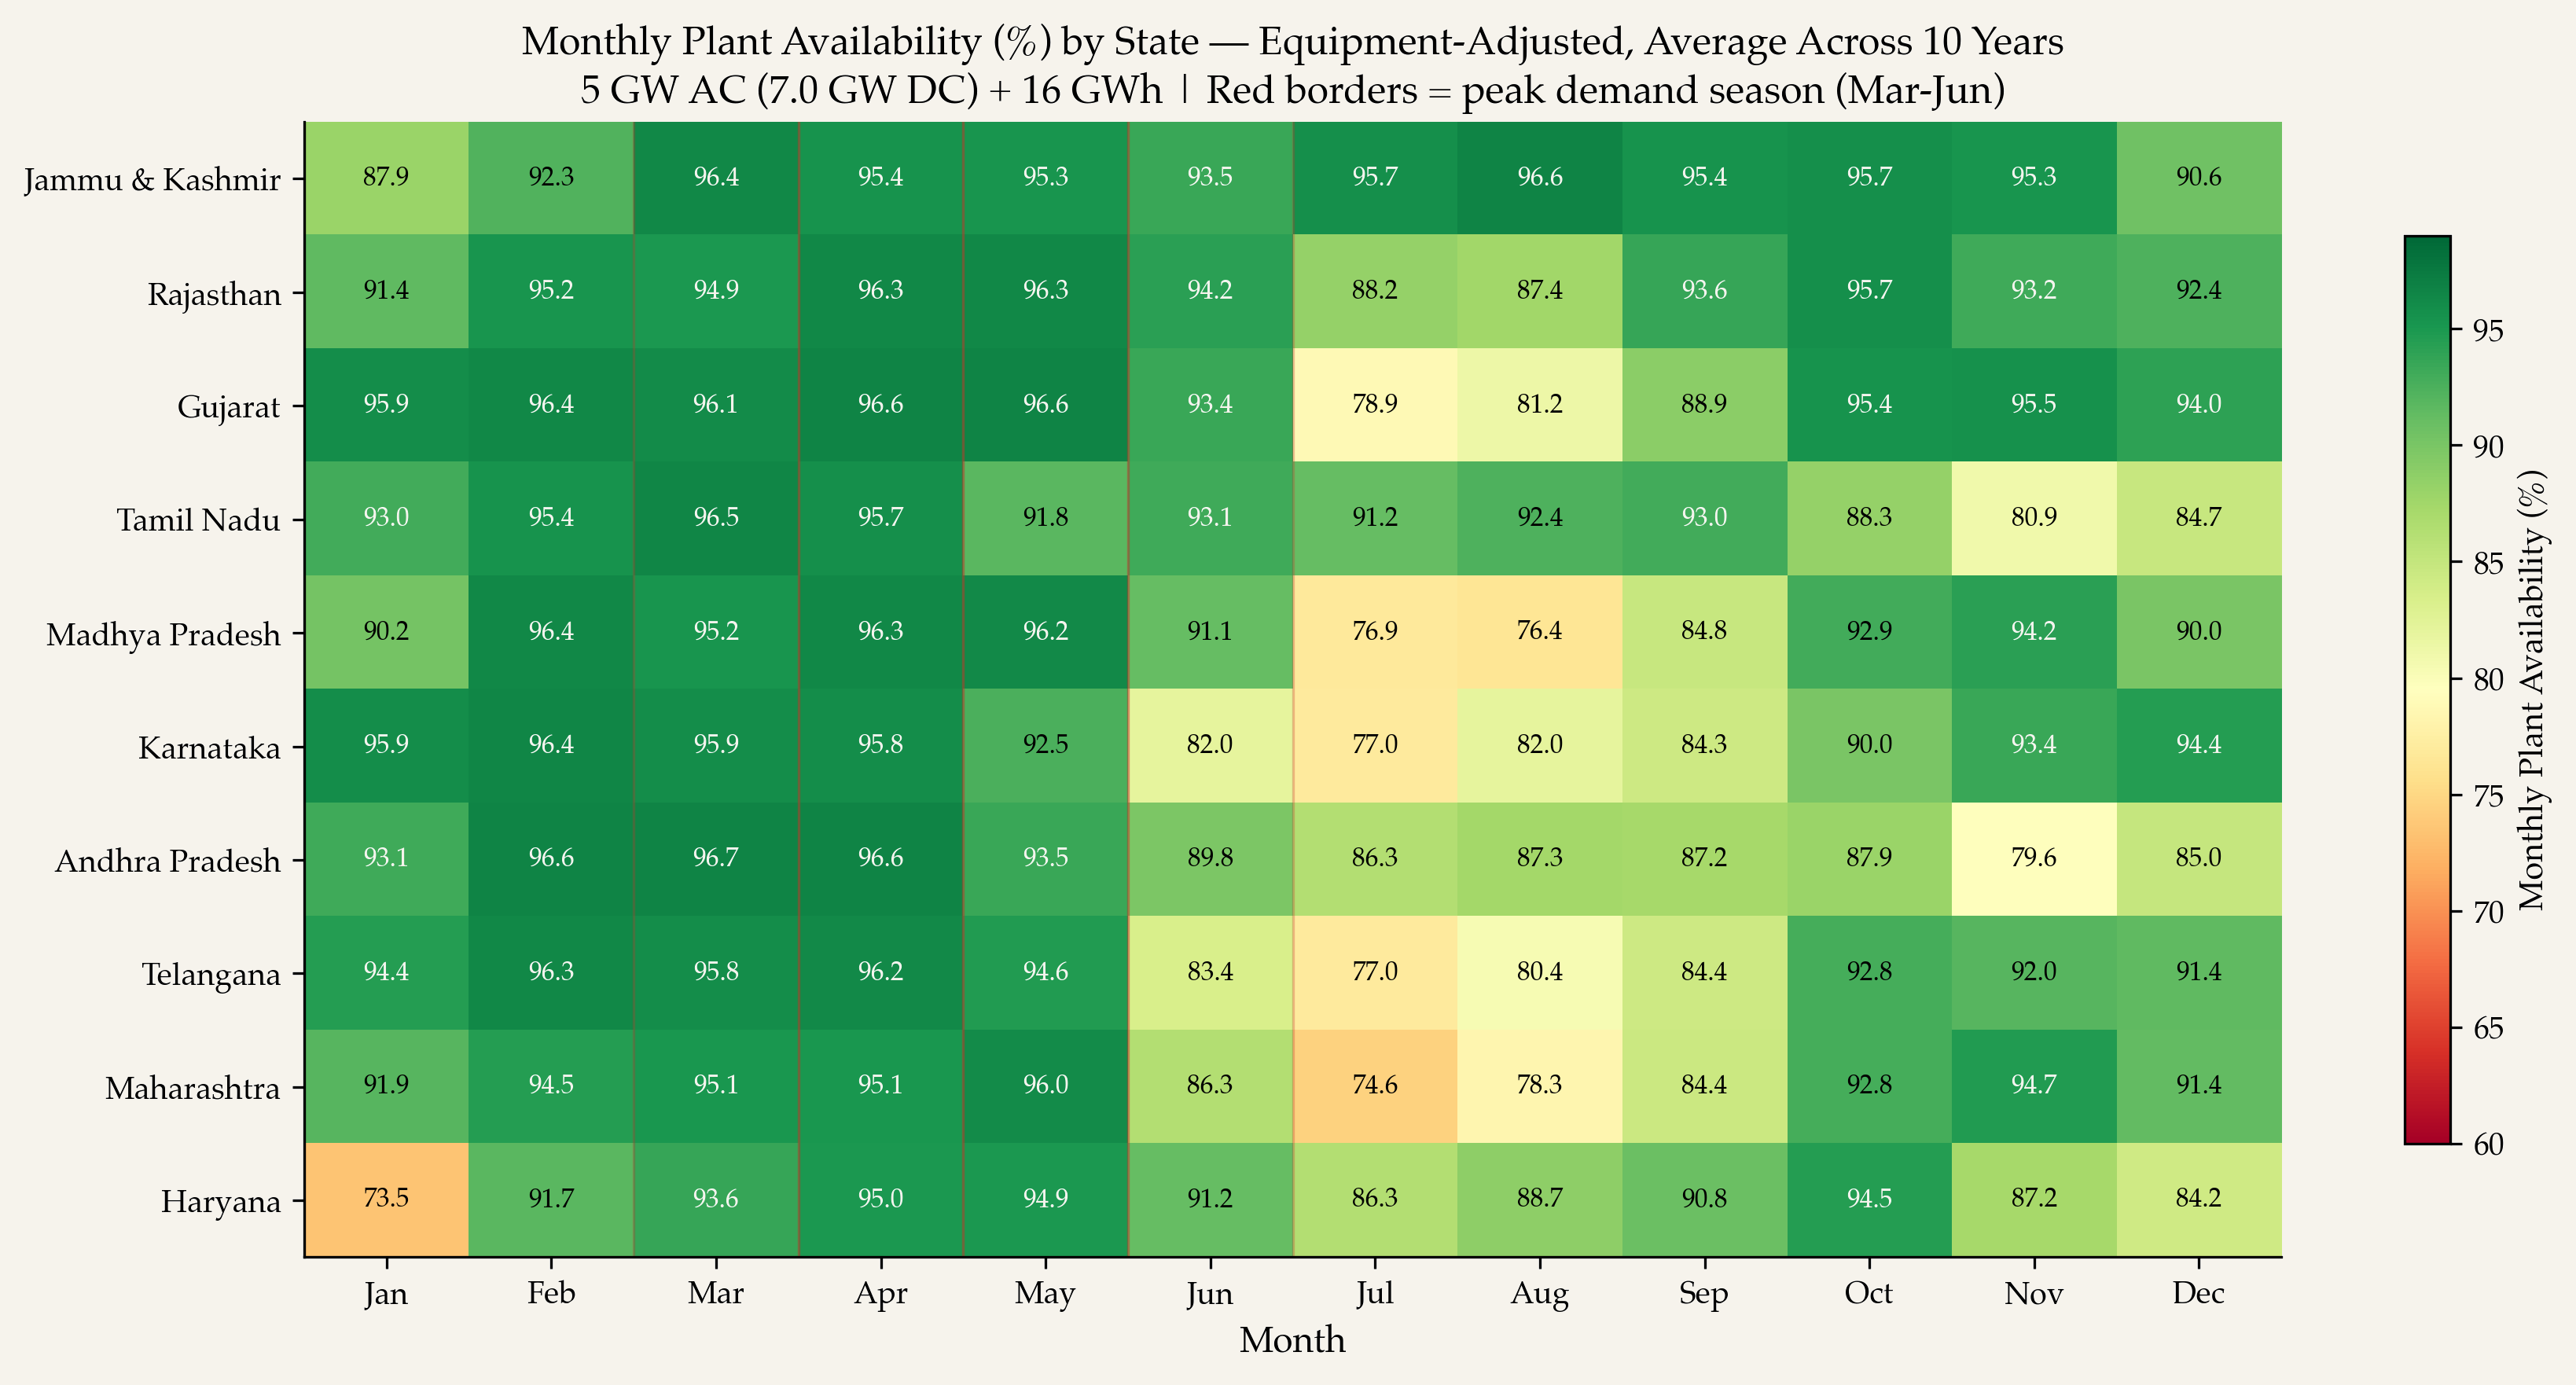
Figure 2 shows how availability varies month-by-month across all 10 states.
Figure 2
UC BERKELEY ANALYSIS · AUGUST 2026
The monthly heatmap reveals the seasonal pattern across states, averaged across 10 weather years. March through May delivers 92–97 percent availability at all states. The monsoon (July–September) dips to as low as 75 percent at lower-CF inland states (Karnataka, Maharashtra, Madhya Pradesh, Telangana, Gujarat), the binding constraint on annual plant availability. While the 10-year averages comfortably exceed the 70 percent monthly floor at all states, individual weather years can fall below: 16 of 100 site-years have at least one month below 70 percent, with the worst case at 61 percent (Andhra Pradesh, November 2021). Notably, several of these binding low months fall outside the monsoon, in the post-monsoon and winter period — Andhra Pradesh and Tamil Nadu in November and Haryana in January — reflecting the shorter winter days at the lowest-resource sites rather than monsoon cloud cover (6 of the 16 binding worst-months are November or January). An additional 2 site-years (Telangana 2015 and Karnataka 2022) fail the peak-month criterion without a sub-70 month, bringing the combined three-criteria failure count to 18 — these are the site-years marked with asterisks in Figure 1. [Proposed move to Appendix B: Figure 3 and the four paragraphs below. The battery-carries-the-night point is already made by Figures 1, 2, and 4.]
Figure 3 shows how availability varies hour-by-hour within each month for a representative plant in Rajasthan, averaged across 10 weather years.
Availability peaks with the pre-monsoon demand season and dips only in the monsoon
Availability by month and hour of day · median state-year · % of rated output
UC BERKELEY ANALYSIS · AUGUST 2026
View the data table
% of days in the month meeting the 1 GW target at that hour. Twelve months × 24 hours, weather only — no equipment derate. The 10th and 90th percentiles are taken across the ten weather years.
| Month | Hour | Mean (%) | 10th percentile (%) | 90th percentile (%) |
|---|---|---|---|---|
| Jan | 00:00 | 94.2 | 87.1 | 100 |
| Jan | 01:00 | 93.5 | 86.8 | 100 |
| Jan | 02:00 | 93.2 | 86.8 | 100 |
| Jan | 03:00 | 92.6 | 83.9 | 100 |
| Jan | 04:00 | 91.6 | 83.5 | 100 |
| Jan | 05:00 | 90 | 80.3 | 97.1 |
| Jan | 06:00 | 88.4 | 79.7 | 97.1 |
| Jan | 07:00 | 86.1 | 71 | 97.1 |
| Jan | 08:00 | 75.8 | 64.2 | 91 |
| Jan | 09:00 | 92.3 | 86.1 | 100 |
| Jan | 10:00 | 96.1 | 87.1 | 100 |
| Jan | 11:00 | 97.1 | 92.9 | 100 |
| Jan | 12:00 | 97.7 | 96.1 | 100 |
| Jan | 13:00 | 99 | 96.8 | 100 |
| Jan | 14:00 | 99 | 96.8 | 100 |
| Jan | 15:00 | 99 | 96.8 | 100 |
| Jan | 16:00 | 99 | 96.8 | 100 |
| Jan | 17:00 | 98.7 | 96.5 | 100 |
| Jan | 18:00 | 98.1 | 93.5 | 100 |
| Jan | 19:00 | 98.1 | 93.5 | 100 |
| Jan | 20:00 | 97.1 | 93.2 | 100 |
| Jan | 21:00 | 96.1 | 90.3 | 100 |
| Jan | 22:00 | 95.2 | 87.1 | 100 |
| Jan | 23:00 | 94.5 | 87.1 | 100 |
| Feb | 00:00 | 98.2 | 92.9 | 100 |
| Feb | 01:00 | 97.9 | 92.9 | 100 |
| Feb | 02:00 | 97.5 | 92.9 | 100 |
| Feb | 03:00 | 97.1 | 92.9 | 100 |
| Feb | 04:00 | 97.1 | 92.9 | 100 |
| Feb | 05:00 | 96.1 | 92.5 | 100 |
| Feb | 06:00 | 95.7 | 89.3 | 100 |
| Feb | 07:00 | 93.9 | 85.7 | 100 |
| Feb | 08:00 | 94.6 | 85.7 | 100 |
| Feb | 09:00 | 96.8 | 89.3 | 100 |
| Feb | 10:00 | 98.9 | 96.4 | 100 |
| Feb | 11:00 | 100 | 100 | 100 |
| Feb | 12:00 | 100 | 100 | 100 |
| Feb | 13:00 | 100 | 100 | 100 |
| Feb | 14:00 | 100 | 100 | 100 |
| Feb | 15:00 | 100 | 100 | 100 |
| Feb | 16:00 | 100 | 100 | 100 |
| Feb | 17:00 | 100 | 100 | 100 |
| Feb | 18:00 | 100 | 100 | 100 |
| Feb | 19:00 | 99.6 | 99.6 | 100 |
| Feb | 20:00 | 99.3 | 96.4 | 100 |
| Feb | 21:00 | 98.2 | 92.9 | 100 |
| Feb | 22:00 | 98.2 | 92.9 | 100 |
| Feb | 23:00 | 98.2 | 92.9 | 100 |
| Mar | 00:00 | 98.7 | 96.8 | 100 |
| Mar | 01:00 | 98.7 | 96.8 | 100 |
| Mar | 02:00 | 97.1 | 93.2 | 100 |
| Mar | 03:00 | 96.8 | 90.3 | 100 |
| Mar | 04:00 | 96.5 | 90 | 100 |
| Mar | 05:00 | 95.8 | 90 | 100 |
| Mar | 06:00 | 93.2 | 86.5 | 97.1 |
| Mar | 07:00 | 92.3 | 83.5 | 97.1 |
| Mar | 08:00 | 96.1 | 90 | 100 |
| Mar | 09:00 | 98.7 | 96.5 | 100 |
| Mar | 10:00 | 99.4 | 96.8 | 100 |
| Mar | 11:00 | 99.4 | 96.8 | 100 |
| Mar | 12:00 | 99.7 | 99.7 | 100 |
| Mar | 13:00 | 100 | 100 | 100 |
| Mar | 14:00 | 100 | 100 | 100 |
| Mar | 15:00 | 99.7 | 99.7 | 100 |
| Mar | 16:00 | 99.7 | 99.7 | 100 |
| Mar | 17:00 | 99.7 | 99.7 | 100 |
| Mar | 18:00 | 99.4 | 96.8 | 100 |
| Mar | 19:00 | 99 | 96.8 | 100 |
| Mar | 20:00 | 99 | 96.8 | 100 |
| Mar | 21:00 | 99 | 96.8 | 100 |
| Mar | 22:00 | 99 | 96.8 | 100 |
| Mar | 23:00 | 99 | 96.8 | 100 |
| Apr | 00:00 | 99.3 | 99.3 | 100 |
| Apr | 01:00 | 99 | 99 | 100 |
| Apr | 02:00 | 99 | 99 | 100 |
| Apr | 03:00 | 98.3 | 93 | 100 |
| Apr | 04:00 | 98 | 92.7 | 100 |
| Apr | 05:00 | 97.7 | 92.7 | 100 |
| Apr | 06:00 | 97 | 89.7 | 100 |
| Apr | 07:00 | 96.3 | 89.3 | 100 |
| Apr | 08:00 | 99 | 96.7 | 100 |
| Apr | 09:00 | 99.7 | 99.7 | 100 |
| Apr | 10:00 | 100 | 100 | 100 |
| Apr | 11:00 | 100 | 100 | 100 |
| Apr | 12:00 | 100 | 100 | 100 |
| Apr | 13:00 | 100 | 100 | 100 |
| Apr | 14:00 | 100 | 100 | 100 |
| Apr | 15:00 | 100 | 100 | 100 |
| Apr | 16:00 | 100 | 100 | 100 |
| Apr | 17:00 | 100 | 100 | 100 |
| Apr | 18:00 | 100 | 100 | 100 |
| Apr | 19:00 | 100 | 100 | 100 |
| Apr | 20:00 | 100 | 100 | 100 |
| Apr | 21:00 | 99.7 | 99.7 | 100 |
| Apr | 22:00 | 99.7 | 99.7 | 100 |
| Apr | 23:00 | 99.7 | 99.7 | 100 |
| May | 00:00 | 99.4 | 96.8 | 100 |
| May | 01:00 | 99.4 | 96.8 | 100 |
| May | 02:00 | 99 | 96.8 | 100 |
| May | 03:00 | 99 | 96.8 | 100 |
| May | 04:00 | 99 | 96.8 | 100 |
| May | 05:00 | 99 | 96.8 | 100 |
| May | 06:00 | 98.7 | 96.8 | 100 |
| May | 07:00 | 98.1 | 96.8 | 100 |
| May | 08:00 | 100 | 100 | 100 |
| May | 09:00 | 100 | 100 | 100 |
| May | 10:00 | 100 | 100 | 100 |
| May | 11:00 | 100 | 100 | 100 |
| May | 12:00 | 100 | 100 | 100 |
| May | 13:00 | 100 | 100 | 100 |
| May | 14:00 | 100 | 100 | 100 |
| May | 15:00 | 100 | 100 | 100 |
| May | 16:00 | 100 | 100 | 100 |
| May | 17:00 | 100 | 100 | 100 |
| May | 18:00 | 99.7 | 99.7 | 100 |
| May | 19:00 | 99.7 | 99.7 | 100 |
| May | 20:00 | 99.7 | 99.7 | 100 |
| May | 21:00 | 99.7 | 99.7 | 100 |
| May | 22:00 | 99.7 | 99.7 | 100 |
| May | 23:00 | 99.4 | 96.8 | 100 |
| Jun | 00:00 | 98 | 96.3 | 100 |
| Jun | 01:00 | 97 | 93 | 100 |
| Jun | 02:00 | 96.3 | 93 | 100 |
| Jun | 03:00 | 94.7 | 89.7 | 100 |
| Jun | 04:00 | 93.7 | 86.7 | 100 |
| Jun | 05:00 | 92 | 86.3 | 100 |
| Jun | 06:00 | 90.3 | 83.3 | 97 |
| Jun | 07:00 | 89.7 | 83.3 | 97 |
| Jun | 08:00 | 95 | 89.7 | 100 |
| Jun | 09:00 | 98 | 96.3 | 100 |
| Jun | 10:00 | 98.7 | 96.7 | 100 |
| Jun | 11:00 | 100 | 100 | 100 |
| Jun | 12:00 | 100 | 100 | 100 |
| Jun | 13:00 | 100 | 100 | 100 |
| Jun | 14:00 | 100 | 100 | 100 |
| Jun | 15:00 | 100 | 100 | 100 |
| Jun | 16:00 | 99.7 | 99.7 | 100 |
| Jun | 17:00 | 99.7 | 99.7 | 100 |
| Jun | 18:00 | 99.3 | 96.7 | 100 |
| Jun | 19:00 | 99.3 | 96.7 | 100 |
| Jun | 20:00 | 98.7 | 96.7 | 100 |
| Jun | 21:00 | 98.3 | 96.3 | 100 |
| Jun | 22:00 | 98 | 96.3 | 100 |
| Jun | 23:00 | 98 | 96.3 | 100 |
| Jul | 00:00 | 89.4 | 77.4 | 100 |
| Jul | 01:00 | 87.1 | 77.4 | 97.1 |
| Jul | 02:00 | 84.2 | 73.9 | 93.9 |
| Jul | 03:00 | 82.3 | 73.9 | 93.5 |
| Jul | 04:00 | 79.4 | 67.7 | 90.6 |
| Jul | 05:00 | 75.8 | 63.9 | 87.1 |
| Jul | 06:00 | 72.6 | 61 | 84.2 |
| Jul | 07:00 | 69.4 | 57.7 | 81 |
| Jul | 08:00 | 84.2 | 71 | 93.5 |
| Jul | 09:00 | 92.3 | 80.6 | 100 |
| Jul | 10:00 | 96.1 | 92.9 | 100 |
| Jul | 11:00 | 99 | 96.5 | 100 |
| Jul | 12:00 | 99.7 | 99.7 | 100 |
| Jul | 13:00 | 100 | 100 | 100 |
| Jul | 14:00 | 100 | 100 | 100 |
| Jul | 15:00 | 100 | 100 | 100 |
| Jul | 16:00 | 100 | 100 | 100 |
| Jul | 17:00 | 99.7 | 99.7 | 100 |
| Jul | 18:00 | 99.7 | 99.7 | 100 |
| Jul | 19:00 | 97.4 | 93.2 | 100 |
| Jul | 20:00 | 96.1 | 90 | 100 |
| Jul | 21:00 | 94.5 | 87.1 | 100 |
| Jul | 22:00 | 93.9 | 87.1 | 100 |
| Jul | 23:00 | 90.6 | 80.6 | 100 |
| Aug | 00:00 | 89.7 | 80 | 100 |
| Aug | 01:00 | 86.5 | 76.5 | 97.1 |
| Aug | 02:00 | 83.5 | 67.4 | 93.9 |
| Aug | 03:00 | 79.7 | 63.9 | 93.5 |
| Aug | 04:00 | 76.5 | 63.9 | 90.6 |
| Aug | 05:00 | 72.9 | 60.3 | 87.4 |
| Aug | 06:00 | 69.7 | 54.2 | 87.4 |
| Aug | 07:00 | 66.5 | 51.3 | 83.9 |
| Aug | 08:00 | 81 | 72.9 | 93.5 |
| Aug | 09:00 | 91.6 | 85.8 | 97.1 |
| Aug | 10:00 | 96.5 | 93.2 | 100 |
| Aug | 11:00 | 98.7 | 96.5 | 100 |
| Aug | 12:00 | 100 | 100 | 100 |
| Aug | 13:00 | 100 | 100 | 100 |
| Aug | 14:00 | 100 | 100 | 100 |
| Aug | 15:00 | 99.7 | 99.7 | 100 |
| Aug | 16:00 | 99 | 96.5 | 100 |
| Aug | 17:00 | 99 | 96.5 | 100 |
| Aug | 18:00 | 98.7 | 96.1 | 100 |
| Aug | 19:00 | 97.1 | 92.9 | 100 |
| Aug | 20:00 | 96.1 | 89.7 | 100 |
| Aug | 21:00 | 95.2 | 89.4 | 100 |
| Aug | 22:00 | 93.5 | 85.8 | 100 |
| Aug | 23:00 | 92.3 | 85.8 | 100 |
| Sep | 00:00 | 95.7 | 89.7 | 100 |
| Sep | 01:00 | 95.7 | 89.7 | 100 |
| Sep | 02:00 | 94.7 | 89.3 | 100 |
| Sep | 03:00 | 93 | 86 | 100 |
| Sep | 04:00 | 92 | 85.7 | 100 |
| Sep | 05:00 | 90.3 | 79.7 | 100 |
| Sep | 06:00 | 89 | 79.3 | 100 |
| Sep | 07:00 | 87.3 | 76.3 | 100 |
| Sep | 08:00 | 95 | 90 | 100 |
| Sep | 09:00 | 97.7 | 96.3 | 100 |
| Sep | 10:00 | 98.3 | 96.3 | 100 |
| Sep | 11:00 | 99.7 | 99.7 | 100 |
| Sep | 12:00 | 100 | 100 | 100 |
| Sep | 13:00 | 100 | 100 | 100 |
| Sep | 14:00 | 100 | 100 | 100 |
| Sep | 15:00 | 100 | 100 | 100 |
| Sep | 16:00 | 100 | 100 | 100 |
| Sep | 17:00 | 100 | 100 | 100 |
| Sep | 18:00 | 99.7 | 99.7 | 100 |
| Sep | 19:00 | 99.7 | 99.7 | 100 |
| Sep | 20:00 | 99.3 | 96.7 | 100 |
| Sep | 21:00 | 98.3 | 96 | 100 |
| Sep | 22:00 | 97.3 | 93 | 100 |
| Sep | 23:00 | 96.7 | 93 | 100 |
| Oct | 00:00 | 99 | 96.5 | 100 |
| Oct | 01:00 | 98.7 | 96.5 | 100 |
| Oct | 02:00 | 98.4 | 96.5 | 100 |
| Oct | 03:00 | 97.7 | 93.5 | 100 |
| Oct | 04:00 | 97.1 | 93.5 | 100 |
| Oct | 05:00 | 96.5 | 93.5 | 100 |
| Oct | 06:00 | 94.8 | 92.9 | 100 |
| Oct | 07:00 | 92.9 | 86.8 | 100 |
| Oct | 08:00 | 98.1 | 96.5 | 100 |
| Oct | 09:00 | 99.7 | 99.7 | 100 |
| Oct | 10:00 | 99.7 | 99.7 | 100 |
| Oct | 11:00 | 100 | 100 | 100 |
| Oct | 12:00 | 100 | 100 | 100 |
| Oct | 13:00 | 100 | 100 | 100 |
| Oct | 14:00 | 100 | 100 | 100 |
| Oct | 15:00 | 100 | 100 | 100 |
| Oct | 16:00 | 100 | 100 | 100 |
| Oct | 17:00 | 100 | 100 | 100 |
| Oct | 18:00 | 99.7 | 99.7 | 100 |
| Oct | 19:00 | 99.7 | 99.7 | 100 |
| Oct | 20:00 | 99.7 | 99.7 | 100 |
| Oct | 21:00 | 99.7 | 99.7 | 100 |
| Oct | 22:00 | 99 | 96.5 | 100 |
| Oct | 23:00 | 99 | 96.5 | 100 |
| Nov | 00:00 | 98.3 | 93 | 100 |
| Nov | 01:00 | 97.7 | 92.7 | 100 |
| Nov | 02:00 | 97 | 92.3 | 100 |
| Nov | 03:00 | 96.3 | 86.3 | 100 |
| Nov | 04:00 | 95.3 | 80 | 100 |
| Nov | 05:00 | 94 | 76 | 100 |
| Nov | 06:00 | 92 | 69.3 | 100 |
| Nov | 07:00 | 62.3 | 33 | 84.7 |
| Nov | 08:00 | 91.7 | 75.7 | 100 |
| Nov | 09:00 | 98 | 93.3 | 100 |
| Nov | 10:00 | 99 | 96.3 | 100 |
| Nov | 11:00 | 99 | 96.3 | 100 |
| Nov | 12:00 | 99.3 | 96.7 | 100 |
| Nov | 13:00 | 99.3 | 96.7 | 100 |
| Nov | 14:00 | 99 | 96.3 | 100 |
| Nov | 15:00 | 99 | 96.3 | 100 |
| Nov | 16:00 | 99 | 96.3 | 100 |
| Nov | 17:00 | 99 | 96.3 | 100 |
| Nov | 18:00 | 99 | 96.3 | 100 |
| Nov | 19:00 | 99 | 96.3 | 100 |
| Nov | 20:00 | 99 | 96.3 | 100 |
| Nov | 21:00 | 99 | 96.3 | 100 |
| Nov | 22:00 | 98.7 | 96 | 100 |
| Nov | 23:00 | 98.3 | 93 | 100 |
| Dec | 00:00 | 97.1 | 93.2 | 100 |
| Dec | 01:00 | 96.8 | 90.3 | 100 |
| Dec | 02:00 | 96.1 | 87.1 | 100 |
| Dec | 03:00 | 95.8 | 87.1 | 100 |
| Dec | 04:00 | 95.5 | 87.1 | 100 |
| Dec | 05:00 | 94.5 | 86.5 | 100 |
| Dec | 06:00 | 93.9 | 86.5 | 100 |
| Dec | 07:00 | 53.9 | 44.2 | 64.8 |
| Dec | 08:00 | 80 | 70.6 | 90.3 |
| Dec | 09:00 | 97.1 | 92.3 | 100 |
| Dec | 10:00 | 98.7 | 96.1 | 100 |
| Dec | 11:00 | 99.7 | 99.7 | 100 |
| Dec | 12:00 | 100 | 100 | 100 |
| Dec | 13:00 | 99.7 | 99.7 | 100 |
| Dec | 14:00 | 99.7 | 99.7 | 100 |
| Dec | 15:00 | 99.7 | 99.7 | 100 |
| Dec | 16:00 | 99.4 | 96.8 | 100 |
| Dec | 17:00 | 99.4 | 96.8 | 100 |
| Dec | 18:00 | 99 | 96.5 | 100 |
| Dec | 19:00 | 99 | 96.5 | 100 |
| Dec | 20:00 | 98.7 | 96.1 | 100 |
| Dec | 21:00 | 98.7 | 96.1 | 100 |
| Dec | 22:00 | 98.7 | 96.1 | 100 |
| Dec | 23:00 | 98.4 | 96.1 | 100 |
During peak demand months (March through June), weather-only availability remains above 92 percent in nearly every hour of the day, including nighttime hours when the battery alone sustains output, dipping to about 90 percent only at the June pre-dawn and early-morning ramp (around 6–7 AM). Across all peak-month hours, the average is 98 percent. During daytime and evening hours (9 AM through 6 PM), availability is at or near 100 percent. This directly addresses the concern that solar-plus-storage cannot reliably deliver through the night: during peak months, it can.
During monsoon months (July through September), availability dips, particularly in the early morning hours (5–8 AM) when the battery is depleted from overnight discharge and solar generation has not yet ramped up. Even so, average monsoon availability remains 92 percent across all hours, and daytime hours (10 AM through 6 PM) remain at or near 100 percent as solar generation directly serves the target.
The sharp drops visible in Figure 3, particularly at 7 AM in November and December, reflect the binary nature of the availability metric: an hour where the plant delivers 0.95 GW counts identically to an hour where it delivers zero. In practice these shortfall hours split into two distinct populations. About half are deep shortfalls (exact zeros) concentrated in the pre-dawn hours when the battery has fully discharged overnight and solar has not yet risen (51 percent of Rajasthan’s shortfall hours, and 57 percent pooled across all sites, deliver zero). The remainder cluster around the dawn and dusk ramps. Because the binary metric scores a 0.99 GW hour identically to a 0 GW hour, the figure’s sharp drops conflate the two; the underlying energy shortfall is smaller than the availability figure implies, but the shortfalls are genuine night-time gaps rather than uniform near-misses.
These early-morning shortfalls are also a direct consequence of the myopic, greedy dispatch algorithm used in this analysis, which does not employ any forecasting or intertemporal optimization. With access to even a one- or two-day solar forecast, which is standard practice in commercial plant operations, an operator could strategically manage battery state of charge to avoid concentrated shortfalls at predictable hours. For example, during monsoon months, the operator could derate the flat block by 10–20 percent and still deliver firm power at the reduced capacity, rather than maintaining the full 1 GW target and accepting binary shortfalls. Such strategies would substantially reduce the apparent availability dips without requiring any additional hardware.
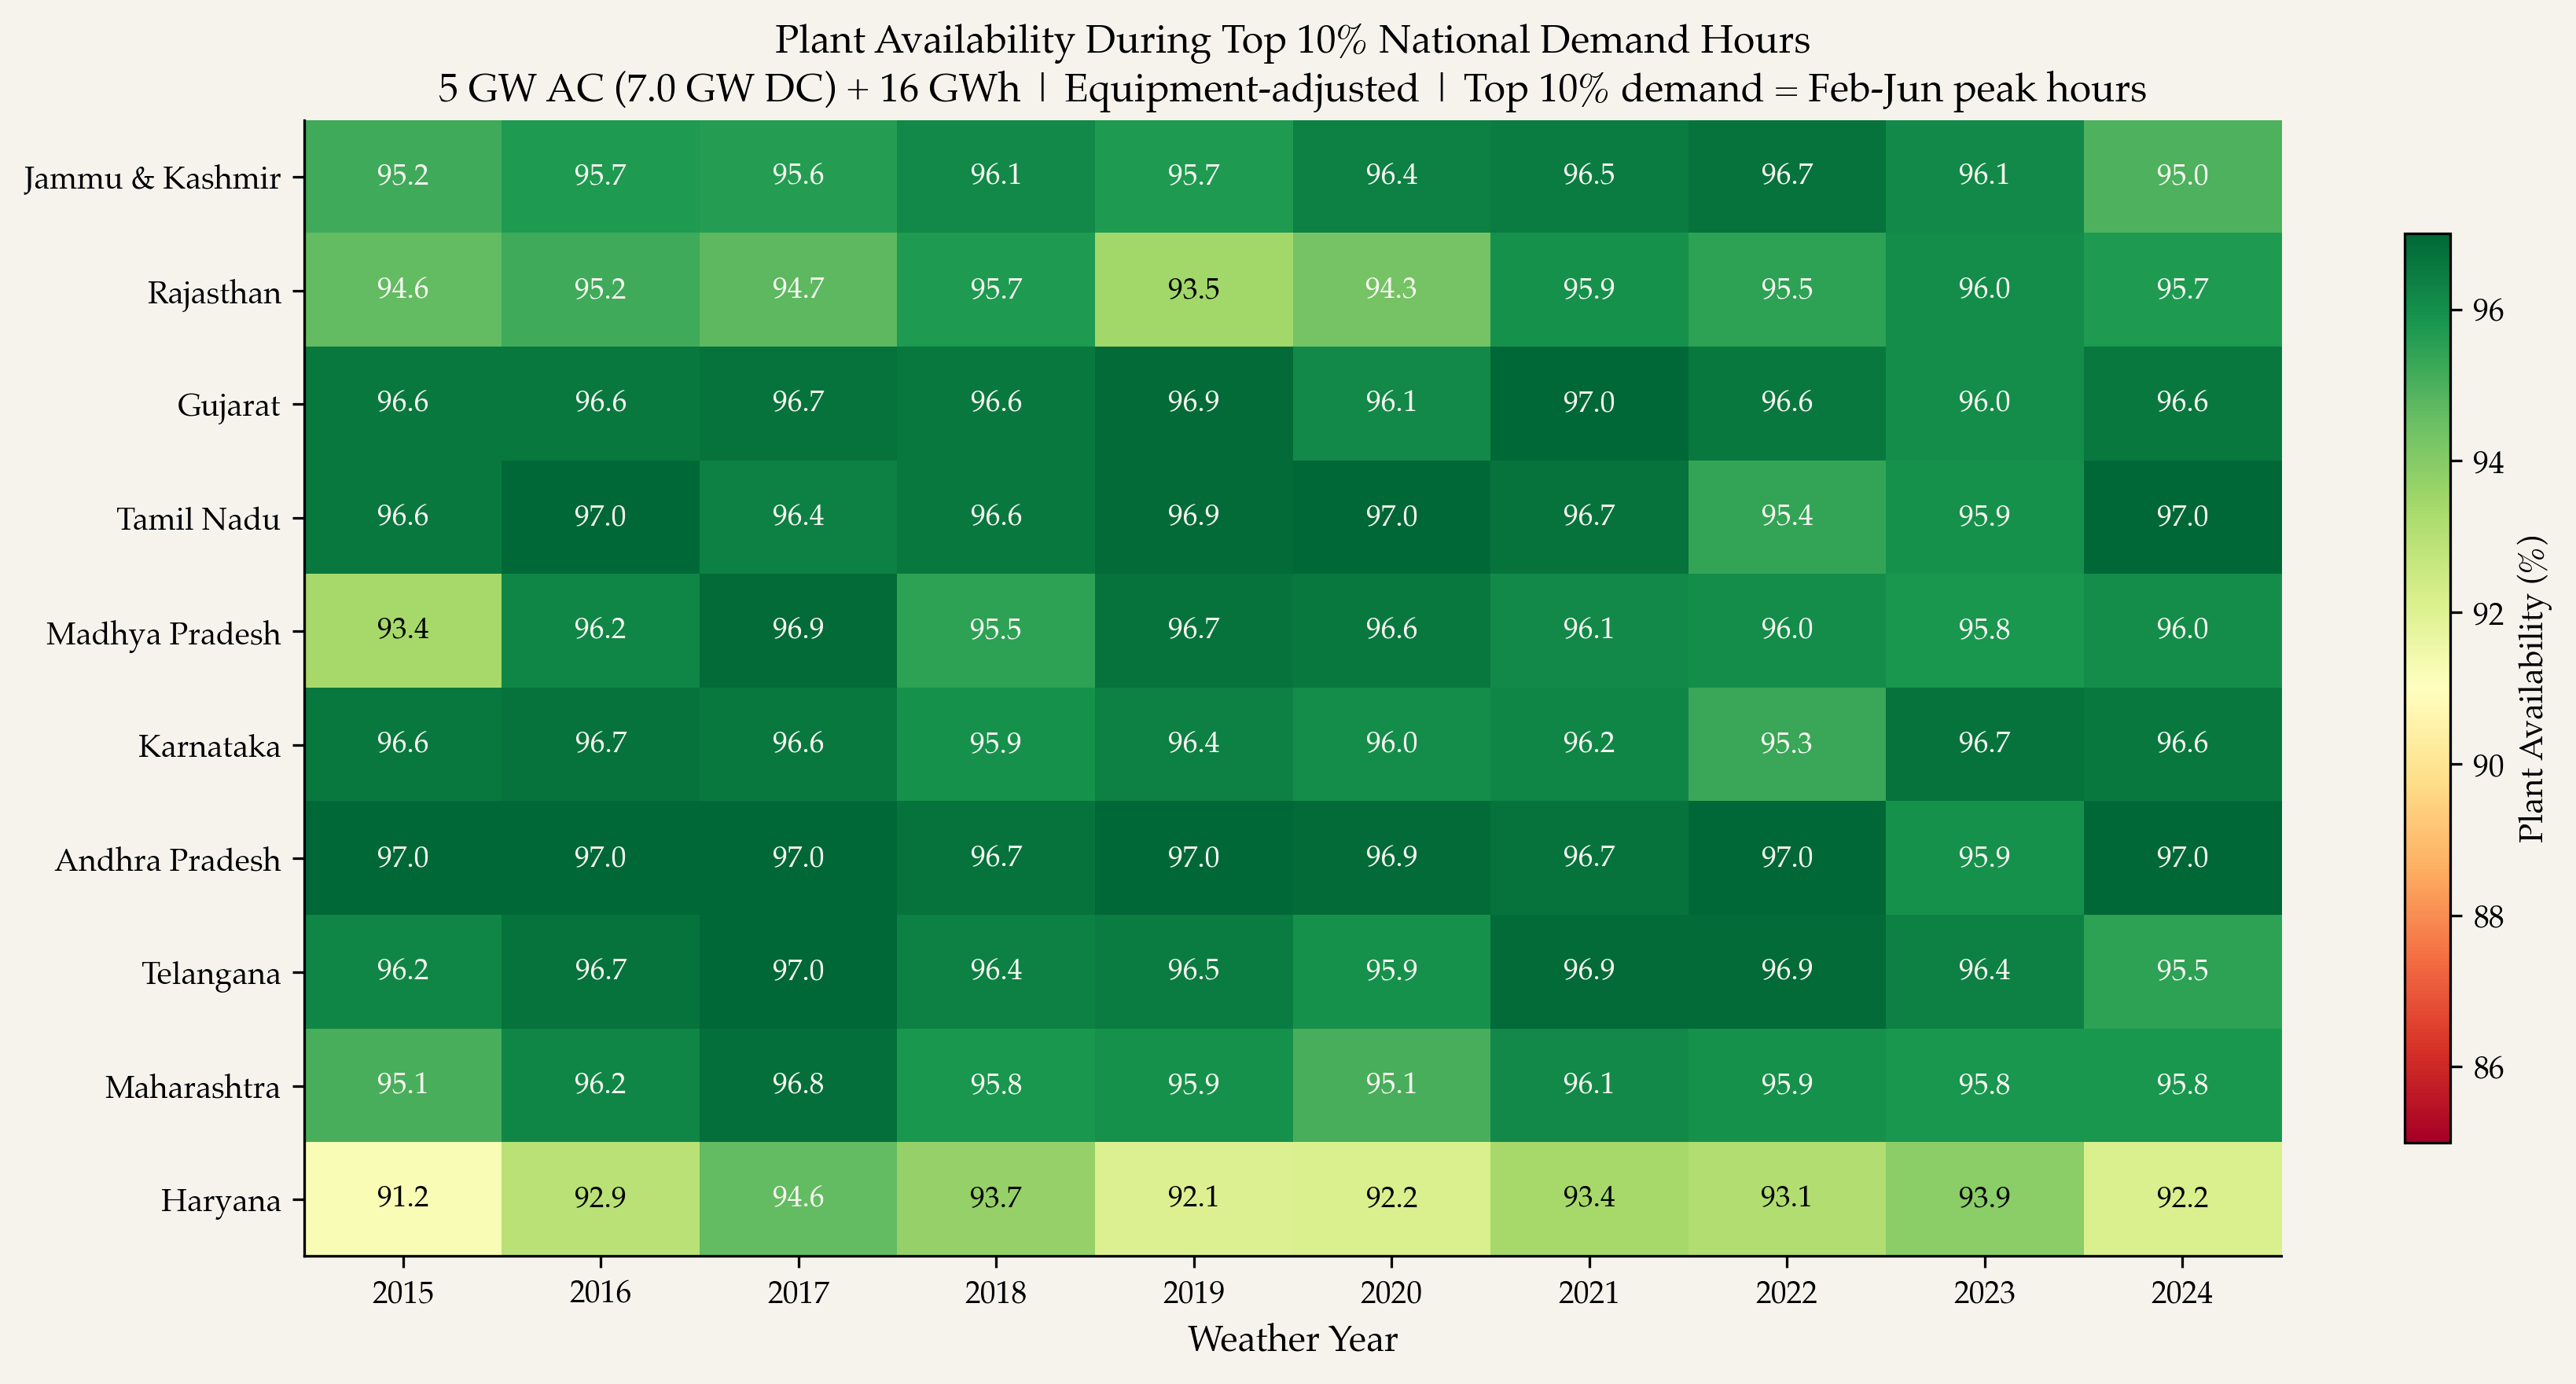
Figure 4 shows plant availability during the top 10 percent of national demand hours.
Figure 4
UC BERKELEY ANALYSIS · AUGUST 2026
Figure 4: Plant availability during the top 10 percent of national electricity demand hours (identified from FY2023 hourly demand data from Grid-India, formerly POSOCO, concentrated in February–June afternoon and evening periods), equipment-adjusted. The top-10 percent window (February–June) is slightly broader than the Mar–Jun peak-month criterion used as a compliance test elsewhere in this paper, but consistent with it: 93 percent of top-10 percent demand hours fall within February–June.
During the top 10 percent of demand hours (approximately 900 hours per year, concentrated in the February–June peak season), equipment-adjusted availability exceeds 93 percent in 9 of 10 states, with Haryana the sole exception at 92.9 percent. India’s peak electricity demand coincides with its strongest solar months, making solar-plus-storage most reliable exactly when the grid needs it most.
When and where shortfalls occur. The average plant experiences 546 shortfall hours per year, roughly 6 percent of the year. These shortfalls are not randomly distributed; they concentrate in periods of low grid stress.
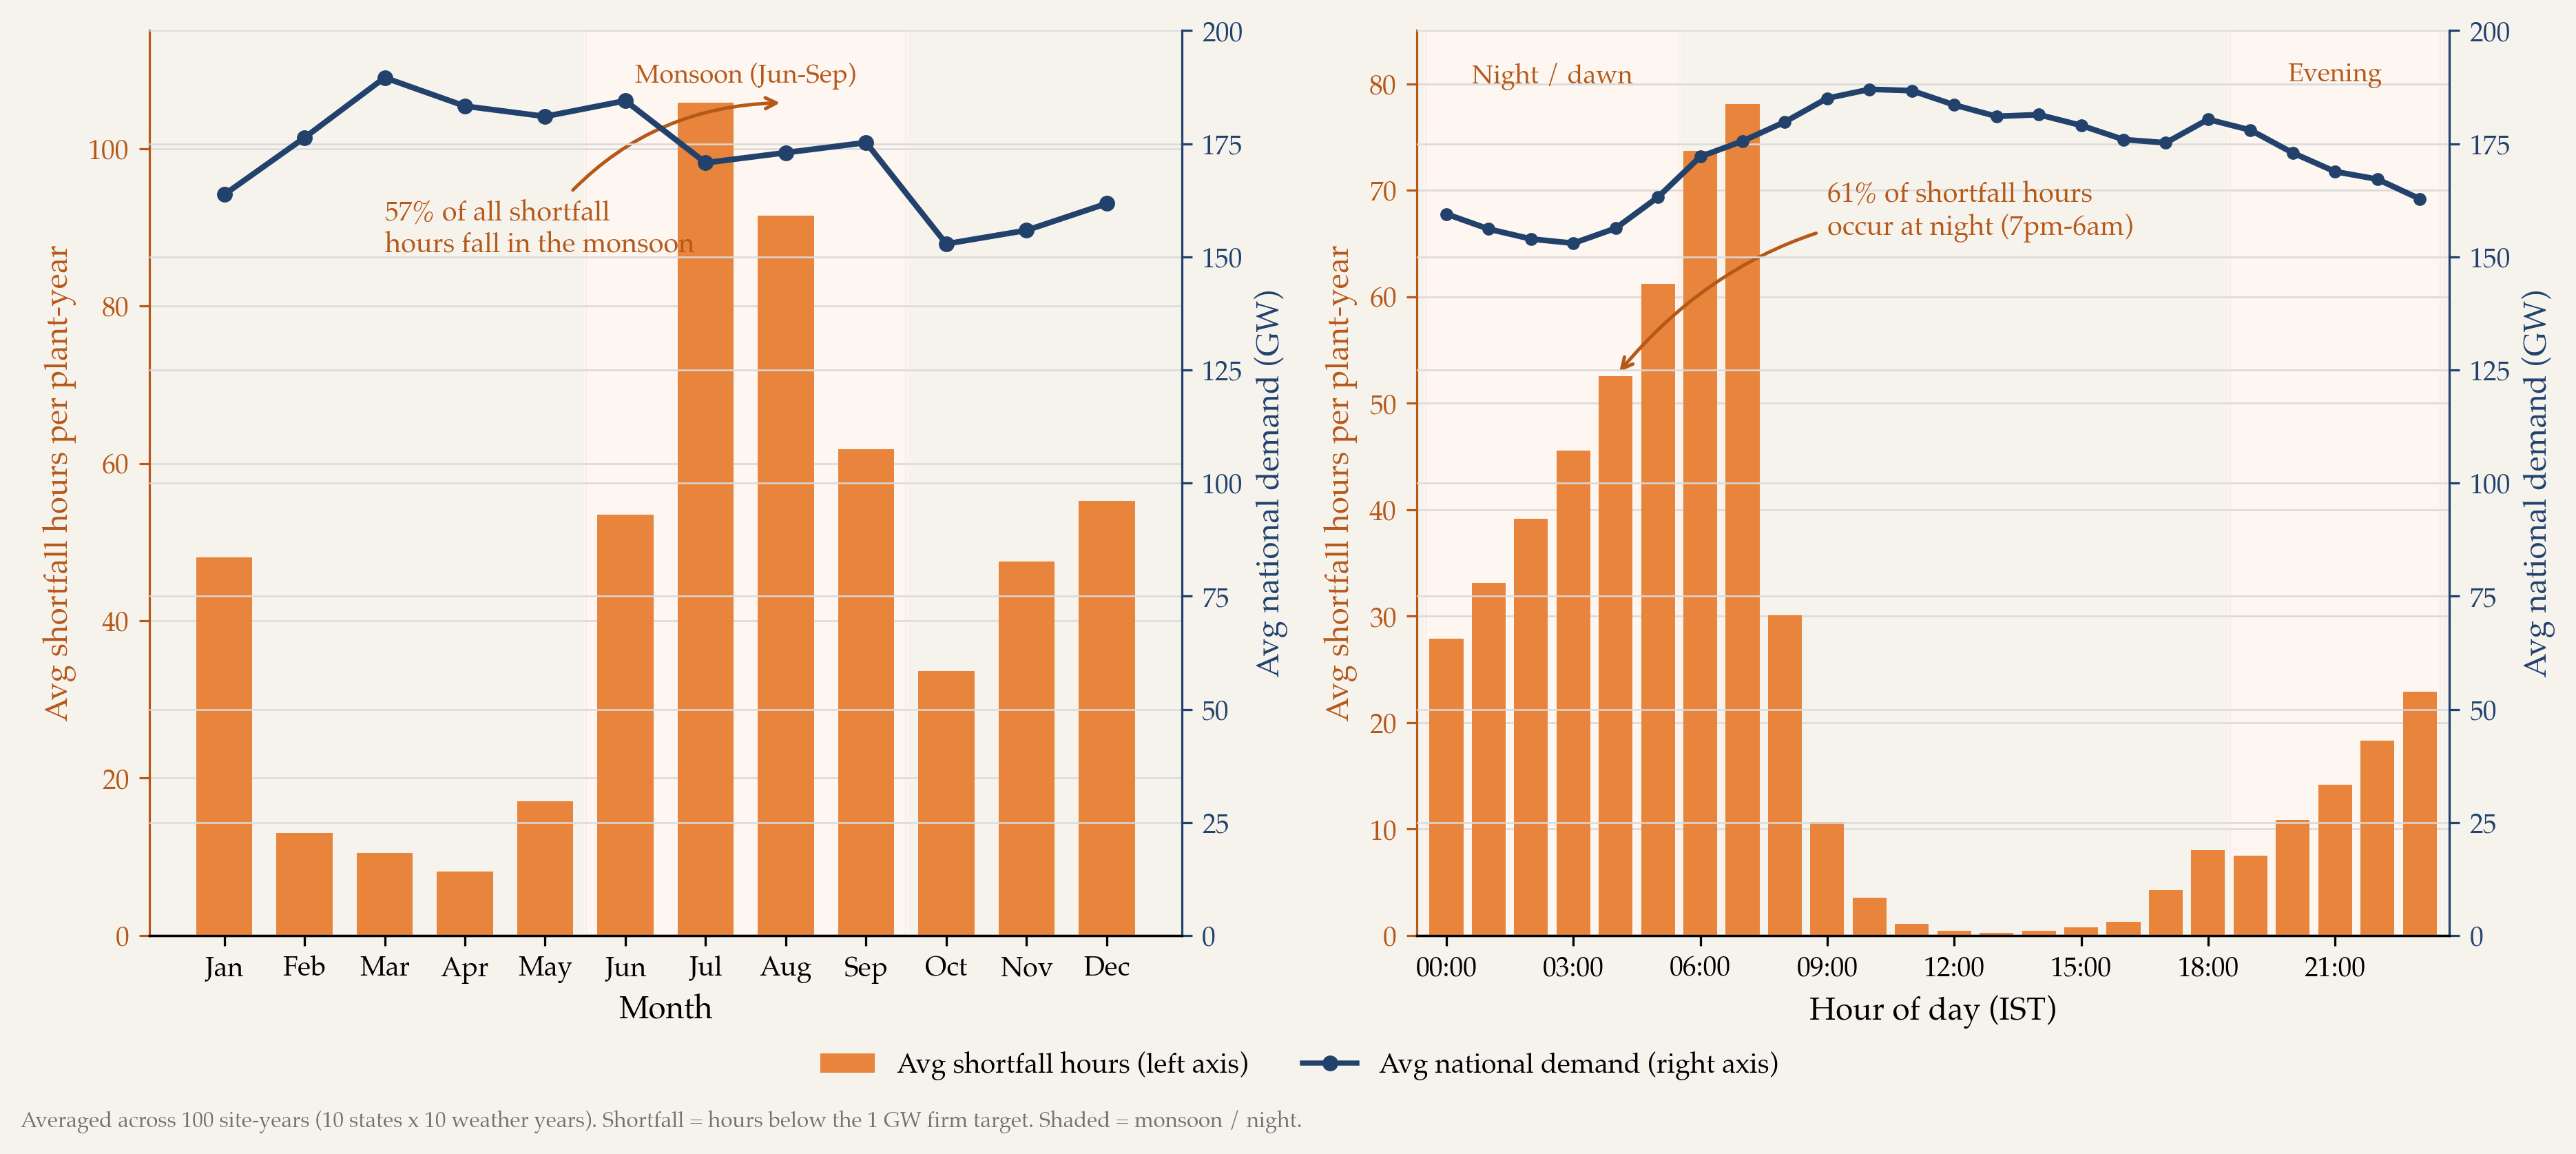
Figure 5 shows when shortfall hours occur, disaggregated by month and hour of day, overlaid with national electricity demand.
Figure 5
UC BERKELEY ANALYSIS · AUGUST 2026
- 57 percent of shortfall hours fall during monsoon months (June through September, a window that includes June’s monsoon onset; the core monsoon window used elsewhere in this paper is July–September), when national electricity demand is below its annual average.
- 61 percent occur at nighttime (7 PM to 5:59 AM), when solar generation has ceased and the battery must sustain output through the night, also the period of lowest daily demand. The single largest concentration falls at the pre-dawn and early-morning ramp (around 6–7 AM), when the battery has been drawn down overnight and solar has not yet risen. Across states, shortfall hours range from 254 per year at Jammu and Kashmir (2.9 percent of the year) to 700 at Haryana (8.0 percent), well within the 1,314-hour budget implied by 85 percent availability (Appendix B, Figure B1). The maximum consecutive shortfall is 43 hours at the worst site-year combination; the median across all site-years is 18 hours. For comparison, coal forced outages from boiler failures have a median duration of 3 days (72 hours) in CEA data (CEA, 2024–2025), and individual forced outages routinely persist for one to three weeks.
Hourly dispatch: how shortfalls occur and resolve. Figure 6 shows the hourly dispatch for a five-day window centered on an illustrative low-availability day — the worst day in that site-year: Day 60 (March 1) of Rajasthan 2015, which achieved only 33 percent hourly availability (8 of 24 hours at full rated capacity).
The worst dispatch day, hour by hour
Solar generation, battery flows and delivered output on the illustrative low-availability day · GW
UC BERKELEY ANALYSIS · AUGUST 2026
View the data table
120 hours from 2015-02-27. Solar to load, battery discharge, shortfall and excess solar are the simulated series; delivered is their sum less shortfall and excess, and the floor is the 1.0 GW target.
| Hour | Solar to load (GW) | Battery (GW) | Shortfall (GW) | Excess solar (GW) | Delivered (GW) | Floor (GW) | SOC (GWh) |
|---|---|---|---|---|---|---|---|
| 27 Feb 00:00 | 0.00 | 1.00 | 0.00 | 0.00 | 1.00 | 1.00 | 10.26 |
| 27 Feb 01:00 | 0.00 | 1.00 | 0.00 | 0.00 | 1.00 | 1.00 | 9.17 |
| 27 Feb 02:00 | 0.00 | 1.00 | 0.00 | 0.00 | 1.00 | 1.00 | 8.09 |
| 27 Feb 03:00 | 0.00 | 1.00 | 0.00 | 0.00 | 1.00 | 1.00 | 7.00 |
| 27 Feb 04:00 | 0.00 | 1.00 | 0.00 | 0.00 | 1.00 | 1.00 | 5.91 |
| 27 Feb 05:00 | 0.00 | 1.00 | 0.00 | 0.00 | 1.00 | 1.00 | 4.83 |
| 27 Feb 06:00 | 0.00 | 1.00 | 0.00 | 0.00 | 1.00 | 1.00 | 3.74 |
| 27 Feb 07:00 | 0.02 | 0.98 | 0.00 | 0.00 | 1.00 | 1.00 | 2.67 |
| 27 Feb 08:00 | 1.00 | 0.00 | 0.00 | 0.41 | 1.00 | 1.00 | 3.09 |
| 27 Feb 09:00 | 1.00 | 0.00 | 0.00 | 1.89 | 1.00 | 1.00 | 4.98 |
| 27 Feb 10:00 | 1.00 | 0.00 | 0.00 | 2.96 | 1.00 | 1.00 | 7.93 |
| 27 Feb 11:00 | 1.00 | 0.00 | 0.00 | 3.70 | 1.00 | 1.00 | 11.63 |
| 27 Feb 12:00 | 1.00 | 0.00 | 0.00 | 3.80 | 1.00 | 1.00 | 15.43 |
| 27 Feb 13:00 | 1.00 | 0.00 | 0.00 | 4.00 | 1.00 | 1.00 | 17.78 |
| 27 Feb 14:00 | 1.00 | 0.00 | 0.00 | 3.68 | 1.00 | 1.00 | 17.78 |
| 27 Feb 15:00 | 1.00 | 0.00 | 0.00 | 3.04 | 1.00 | 1.00 | 17.78 |
| 27 Feb 16:00 | 1.00 | 0.00 | 0.00 | 1.96 | 1.00 | 1.00 | 17.78 |
| 27 Feb 17:00 | 1.00 | 0.00 | 0.00 | 0.52 | 1.00 | 1.00 | 17.78 |
| 27 Feb 18:00 | 0.09 | 0.91 | 0.00 | 0.00 | 1.00 | 1.00 | 16.79 |
| 27 Feb 19:00 | 0.00 | 1.00 | 0.00 | 0.00 | 1.00 | 1.00 | 15.70 |
| 27 Feb 20:00 | 0.00 | 1.00 | 0.00 | 0.00 | 1.00 | 1.00 | 14.62 |
| 27 Feb 21:00 | 0.00 | 1.00 | 0.00 | 0.00 | 1.00 | 1.00 | 13.53 |
| 27 Feb 22:00 | 0.00 | 1.00 | 0.00 | 0.00 | 1.00 | 1.00 | 12.44 |
| 27 Feb 23:00 | 0.00 | 1.00 | 0.00 | 0.00 | 1.00 | 1.00 | 11.35 |
| 28 Feb 00:00 | 0.00 | 1.00 | 0.00 | 0.00 | 1.00 | 1.00 | 10.27 |
| 28 Feb 01:00 | 0.00 | 1.00 | 0.00 | 0.00 | 1.00 | 1.00 | 9.18 |
| 28 Feb 02:00 | 0.00 | 1.00 | 0.00 | 0.00 | 1.00 | 1.00 | 8.09 |
| 28 Feb 03:00 | 0.00 | 1.00 | 0.00 | 0.00 | 1.00 | 1.00 | 7.01 |
| 28 Feb 04:00 | 0.00 | 1.00 | 0.00 | 0.00 | 1.00 | 1.00 | 5.92 |
| 28 Feb 05:00 | 0.00 | 1.00 | 0.00 | 0.00 | 1.00 | 1.00 | 4.83 |
| 28 Feb 06:00 | 0.00 | 1.00 | 0.00 | 0.00 | 1.00 | 1.00 | 3.75 |
| 28 Feb 07:00 | 0.01 | 0.99 | 0.00 | 0.00 | 1.00 | 1.00 | 2.67 |
| 28 Feb 08:00 | 0.58 | 0.42 | 0.00 | 0.00 | 1.00 | 1.00 | 2.22 |
| 28 Feb 09:00 | 1.00 | 0.00 | 0.00 | 0.39 | 1.00 | 1.00 | 2.61 |
| 28 Feb 10:00 | 1.00 | 0.00 | 0.00 | 0.05 | 1.00 | 1.00 | 2.66 |
| 28 Feb 11:00 | 1.00 | 0.00 | 0.00 | 0.29 | 1.00 | 1.00 | 2.96 |
| 28 Feb 12:00 | 1.00 | 0.00 | 0.00 | 3.77 | 1.00 | 1.00 | 6.72 |
| 28 Feb 13:00 | 1.00 | 0.00 | 0.00 | 2.51 | 1.00 | 1.00 | 9.23 |
| 28 Feb 14:00 | 1.00 | 0.00 | 0.00 | 2.16 | 1.00 | 1.00 | 11.39 |
| 28 Feb 15:00 | 0.97 | 0.03 | 0.00 | 0.00 | 1.00 | 1.00 | 11.35 |
| 28 Feb 16:00 | 0.88 | 0.13 | 0.00 | 0.00 | 1.00 | 1.00 | 11.22 |
| 28 Feb 17:00 | 0.44 | 0.56 | 0.00 | 0.00 | 1.00 | 1.00 | 10.61 |
| 28 Feb 18:00 | 0.00 | 1.00 | 0.00 | 0.00 | 1.00 | 1.00 | 9.52 |
| 28 Feb 19:00 | 0.00 | 1.00 | 0.00 | 0.00 | 1.00 | 1.00 | 8.43 |
| 28 Feb 20:00 | 0.00 | 1.00 | 0.00 | 0.00 | 1.00 | 1.00 | 7.35 |
| 28 Feb 21:00 | 0.00 | 1.00 | 0.00 | 0.00 | 1.00 | 1.00 | 6.26 |
| 28 Feb 22:00 | 0.00 | 1.00 | 0.00 | 0.00 | 1.00 | 1.00 | 5.17 |
| 28 Feb 23:00 | 0.00 | 1.00 | 0.00 | 0.00 | 1.00 | 1.00 | 4.09 |
| 1 Mar 00:00 | 0.00 | 1.00 | 0.00 | 0.00 | 1.00 | 1.00 | 3.00 |
| 1 Mar 01:00 | 0.00 | 1.00 | 0.00 | 0.00 | 1.00 | 1.00 | 1.91 |
| 1 Mar 02:00 | 0.00 | 0.12 | 0.88 | 0.00 | 0.12 | 1.00 | 1.78 |
| 1 Mar 03:00 | 0.00 | 0.00 | 1.00 | 0.00 | 0.00 | 1.00 | 1.78 |
| 1 Mar 04:00 | 0.00 | 0.00 | 1.00 | 0.00 | 0.00 | 1.00 | 1.78 |
| 1 Mar 05:00 | 0.00 | 0.00 | 1.00 | 0.00 | 0.00 | 1.00 | 1.78 |
| 1 Mar 06:00 | 0.00 | 0.00 | 1.00 | 0.00 | 0.00 | 1.00 | 1.78 |
| 1 Mar 07:00 | 0.00 | 0.00 | 1.00 | 0.00 | 0.00 | 1.00 | 1.78 |
| 1 Mar 08:00 | 0.41 | 0.00 | 0.59 | 0.00 | 0.41 | 1.00 | 1.78 |
| 1 Mar 09:00 | 1.00 | 0.00 | 0.00 | 0.22 | 1.00 | 1.00 | 2.00 |
| 1 Mar 10:00 | 0.70 | 0.20 | 0.10 | 0.00 | 0.90 | 1.00 | 1.78 |
| 1 Mar 11:00 | 0.88 | 0.00 | 0.12 | 0.00 | 0.88 | 1.00 | 1.78 |
| 1 Mar 12:00 | 0.99 | 0.00 | 0.01 | 0.00 | 0.99 | 1.00 | 1.78 |
| 1 Mar 13:00 | 1.00 | 0.00 | 0.00 | 0.96 | 1.00 | 1.00 | 2.74 |
| 1 Mar 14:00 | 0.92 | 0.08 | 0.00 | 0.00 | 1.00 | 1.00 | 2.66 |
| 1 Mar 15:00 | 1.00 | 0.00 | 0.00 | 0.09 | 1.00 | 1.00 | 2.75 |
| 1 Mar 16:00 | 1.00 | 0.00 | 0.00 | 0.19 | 1.00 | 1.00 | 2.94 |
| 1 Mar 17:00 | 0.22 | 0.78 | 0.00 | 0.00 | 1.00 | 1.00 | 2.09 |
| 1 Mar 18:00 | 0.00 | 0.29 | 0.71 | 0.00 | 0.29 | 1.00 | 1.78 |
| 1 Mar 19:00 | 0.00 | 0.00 | 1.00 | 0.00 | 0.00 | 1.00 | 1.78 |
| 1 Mar 20:00 | 0.00 | 0.00 | 1.00 | 0.00 | 0.00 | 1.00 | 1.78 |
| 1 Mar 21:00 | 0.00 | 0.00 | 1.00 | 0.00 | 0.00 | 1.00 | 1.78 |
| 1 Mar 22:00 | 0.00 | 0.00 | 1.00 | 0.00 | 0.00 | 1.00 | 1.78 |
| 1 Mar 23:00 | 0.00 | 0.00 | 1.00 | 0.00 | 0.00 | 1.00 | 1.78 |
| 2 Mar 00:00 | 0.00 | 0.00 | 1.00 | 0.00 | 0.00 | 1.00 | 1.78 |
| 2 Mar 01:00 | 0.00 | 0.00 | 1.00 | 0.00 | 0.00 | 1.00 | 1.78 |
| 2 Mar 02:00 | 0.00 | 0.00 | 1.00 | 0.00 | 0.00 | 1.00 | 1.78 |
| 2 Mar 03:00 | 0.00 | 0.00 | 1.00 | 0.00 | 0.00 | 1.00 | 1.78 |
| 2 Mar 04:00 | 0.00 | 0.00 | 1.00 | 0.00 | 0.00 | 1.00 | 1.78 |
| 2 Mar 05:00 | 0.00 | 0.00 | 1.00 | 0.00 | 0.00 | 1.00 | 1.78 |
| 2 Mar 06:00 | 0.00 | 0.00 | 1.00 | 0.00 | 0.00 | 1.00 | 1.78 |
| 2 Mar 07:00 | 0.02 | 0.00 | 0.98 | 0.00 | 0.02 | 1.00 | 1.78 |
| 2 Mar 08:00 | 1.00 | 0.00 | 0.00 | 0.14 | 1.00 | 1.00 | 1.92 |
| 2 Mar 09:00 | 1.00 | 0.00 | 0.00 | 1.57 | 1.00 | 1.00 | 3.49 |
| 2 Mar 10:00 | 1.00 | 0.00 | 0.00 | 2.69 | 1.00 | 1.00 | 6.18 |
| 2 Mar 11:00 | 1.00 | 0.00 | 0.00 | 3.45 | 1.00 | 1.00 | 9.63 |
| 2 Mar 12:00 | 1.00 | 0.00 | 0.00 | 3.91 | 1.00 | 1.00 | 13.54 |
| 2 Mar 13:00 | 1.00 | 0.00 | 0.00 | 4.00 | 1.00 | 1.00 | 17.53 |
| 2 Mar 14:00 | 1.00 | 0.00 | 0.00 | 3.50 | 1.00 | 1.00 | 17.78 |
| 2 Mar 15:00 | 1.00 | 0.00 | 0.00 | 2.89 | 1.00 | 1.00 | 17.78 |
| 2 Mar 16:00 | 1.00 | 0.00 | 0.00 | 1.83 | 1.00 | 1.00 | 17.78 |
| 2 Mar 17:00 | 1.00 | 0.00 | 0.00 | 0.47 | 1.00 | 1.00 | 17.78 |
| 2 Mar 18:00 | 0.03 | 0.97 | 0.00 | 0.00 | 1.00 | 1.00 | 16.72 |
| 2 Mar 19:00 | 0.00 | 1.00 | 0.00 | 0.00 | 1.00 | 1.00 | 15.63 |
| 2 Mar 20:00 | 0.00 | 1.00 | 0.00 | 0.00 | 1.00 | 1.00 | 14.55 |
| 2 Mar 21:00 | 0.00 | 1.00 | 0.00 | 0.00 | 1.00 | 1.00 | 13.46 |
| 2 Mar 22:00 | 0.00 | 1.00 | 0.00 | 0.00 | 1.00 | 1.00 | 12.37 |
| 2 Mar 23:00 | 0.00 | 1.00 | 0.00 | 0.00 | 1.00 | 1.00 | 11.29 |
| 3 Mar 00:00 | 0.00 | 1.00 | 0.00 | 0.00 | 1.00 | 1.00 | 10.20 |
| 3 Mar 01:00 | 0.00 | 1.00 | 0.00 | 0.00 | 1.00 | 1.00 | 9.11 |
| 3 Mar 02:00 | 0.00 | 1.00 | 0.00 | 0.00 | 1.00 | 1.00 | 8.03 |
| 3 Mar 03:00 | 0.00 | 1.00 | 0.00 | 0.00 | 1.00 | 1.00 | 6.94 |
| 3 Mar 04:00 | 0.00 | 1.00 | 0.00 | 0.00 | 1.00 | 1.00 | 5.85 |
| 3 Mar 05:00 | 0.00 | 1.00 | 0.00 | 0.00 | 1.00 | 1.00 | 4.76 |
| 3 Mar 06:00 | 0.00 | 1.00 | 0.00 | 0.00 | 1.00 | 1.00 | 3.68 |
| 3 Mar 07:00 | 0.06 | 0.94 | 0.00 | 0.00 | 1.00 | 1.00 | 2.66 |
| 3 Mar 08:00 | 1.00 | 0.00 | 0.00 | 0.41 | 1.00 | 1.00 | 3.07 |
| 3 Mar 09:00 | 1.00 | 0.00 | 0.00 | 1.90 | 1.00 | 1.00 | 4.96 |
| 3 Mar 10:00 | 1.00 | 0.00 | 0.00 | 3.03 | 1.00 | 1.00 | 8.00 |
| 3 Mar 11:00 | 1.00 | 0.00 | 0.00 | 3.80 | 1.00 | 1.00 | 11.79 |
| 3 Mar 12:00 | 1.00 | 0.00 | 0.00 | 3.84 | 1.00 | 1.00 | 15.64 |
| 3 Mar 13:00 | 1.00 | 0.00 | 0.00 | 3.91 | 1.00 | 1.00 | 17.78 |
| 3 Mar 14:00 | 1.00 | 0.00 | 0.00 | 3.55 | 1.00 | 1.00 | 17.78 |
| 3 Mar 15:00 | 1.00 | 0.00 | 0.00 | 2.77 | 1.00 | 1.00 | 17.78 |
| 3 Mar 16:00 | 1.00 | 0.00 | 0.00 | 1.79 | 1.00 | 1.00 | 17.78 |
| 3 Mar 17:00 | 1.00 | 0.00 | 0.00 | 0.46 | 1.00 | 1.00 | 17.78 |
| 3 Mar 18:00 | 0.10 | 0.90 | 0.00 | 0.00 | 1.00 | 1.00 | 16.80 |
| 3 Mar 19:00 | 0.00 | 1.00 | 0.00 | 0.00 | 1.00 | 1.00 | 15.71 |
| 3 Mar 20:00 | 0.00 | 1.00 | 0.00 | 0.00 | 1.00 | 1.00 | 14.62 |
| 3 Mar 21:00 | 0.00 | 1.00 | 0.00 | 0.00 | 1.00 | 1.00 | 13.54 |
| 3 Mar 22:00 | 0.00 | 1.00 | 0.00 | 0.00 | 1.00 | 1.00 | 12.45 |
| 3 Mar 23:00 | 0.00 | 1.00 | 0.00 | 0.00 | 1.00 | 1.00 | 11.36 |
On March 1, a severe midday solar collapse prevented the battery from fully recharging. The preceding day (February 28) was itself degraded — among the bottom 5 percent of solar days in 2015 — so the battery entered March 1 from a depleted state rather than a fresh one. The battery depletes through the afternoon and evening, forcing shortfalls in the late evening hours. Solar recovers only partially on March 2, and the plant returns to 100 percent availability by March 3.
Solar-plus-storage shortfalls are self-correcting: the next sunny day refills the battery. In the tail of the distribution the failure mode is sharper than the typical case: 7 of the 100 site-years include an isolated full-day (0 of 24 hours) shortfall during a multi-day low-solar spell, concentrated in the low-irradiance winter months (November through January). These remain weather-driven and self-correct within a few days as irradiance recovers, unlike the open-ended mechanical and fuel-supply outages of a coal plant.
[Proposed cut: Figure 7 and the paragraph below repeat Figure 4’s availability-tracks-demand message; keep Figure 4.]
Figure 7 overlays the monthly plant availability against normalized national electricity demand.
Availability exceeds 93% in the top demand hours in 9 of 10 states
All-India, Jan–Dec. Availability is the share of hours the plant meets its firm target; demand is the monthly mean hour as a percent of the annual peak hour (207,618 MW) — structurally below 100, not a demand level.
UC BERKELEY ANALYSIS · AUGUST 2026
View the data table
% (availability = % of hours >= 1 GW; demand = mean hour as % of peak hour). Demand is the monthly mean hour as a percent of the annual peak hour, so it sits structurally below 100 — it is a shape, not a level.
| Month | Availability (%) | Demand, mean hour as % of peak hour | Peak season |
|---|---|---|---|
| Jan | 90.7 | 78.9 | No |
| Feb | 95.1 | 84.9 | No |
| Mar | 95.6 | 91.3 | Yes |
| Apr | 95.9 | 88.3 | Yes |
| May | 94.8 | 87.2 | Yes |
| Jun | 89.8 | 88.9 | Yes |
| Jul | 83.2 | 82.3 | No |
| Aug | 85.1 | 83.3 | No |
| Sep | 88.7 | 84.4 | No |
| Oct | 92.6 | 73.6 | No |
| Nov | 90.6 | 75.1 | No |
| Dec | 89.8 | 77.9 | No |
The alignment between availability and demand is striking. During March through June, when demand reaches 85–91 percent of its annual peak, plant availability averages 92–97 percent across states in March–May, dropping to 82–94 percent in June as the monsoon begins. During the monsoon (July–August), when demand falls to 82–83 percent of peak, availability dips to 75–92 percent across states, averaging ~83 percent at lower-CF inland states. The plant is most available when the grid needs it most, and least available when the grid is least stressed.
5.2 Comparison with coal fleet
To provide a stringent test, Figures 8 and 9 compare the simulated solar-plus-storage plants in three representative states (Rajasthan, Gujarat, and Madhya Pradesh) against three large, high-availability coal plants (illustrative), using daily outage data from CEA’s Daily Generation Report (Sub-Report-10, June 2024 through May 2025). These are shown as illustrative high-availability large (>= 1,000 MW) coal plants, selected by inspection of CEA Daily Generation Report outage records rather than an exhaustive fleet-wide availability ranking, because the public DGR data does not report per-station rated capacity. They are not state-matched to the solar sites.
Day by day, the solar configuration is available more often than the coal fleet
Daily availability, solar-plus-storage vs India's coal fleet · all hours · % of rated output
UC BERKELEY ANALYSIS OF CEA DATA · AUGUST 2026
View the data table
% of the day available (coal: MW available / rated; solar: hours >= 1 GW / 24). Coal is CEA outage data for June 2024 to May 2025 on a common calendar, with unrecorded days treated as fully available; 29 February is blank. The solar sites are weather only, with no equipment derate.
| Day | Punjab — RAJPURA TPP (%) | Telangana — TELANGANA STPP PH-1 (%) | West Bengal — DURGAPUR STEEL TPS (%) | Rajasthan — solar + storage (%) | Gujarat — solar + storage (%) | Madhya Pradesh — solar + storage (%) |
|---|---|---|---|---|---|---|
| 1 Jan | 100 | 100 | 100 | 100 | 100 | 100 |
| 2 Jan | 100 | 100 | 100 | 100 | 100 | 91.7 |
| 3 Jan | 100 | 100 | 100 | 100 | 100 | 83.3 |
| 4 Jan | 100 | 100 | 100 | 100 | 100 | 79.2 |
| 5 Jan | 100 | 100 | 100 | 100 | 100 | 37.5 |
| 6 Jan | 100 | 100 | 100 | 95.8 | 100 | 41.7 |
| 7 Jan | 100 | 100 | 100 | 100 | 100 | 50 |
| 8 Jan | 100 | 100 | 100 | 95.8 | 100 | 62.5 |
| 9 Jan | 100 | 100 | 100 | 95.8 | 100 | 87.5 |
| 10 Jan | 100 | 100 | 100 | 100 | 100 | 75 |
| 11 Jan | 100 | 100 | 100 | 100 | 100 | 54.2 |
| 12 Jan | 100 | 100 | 100 | 100 | 100 | 62.5 |
| 13 Jan | 100 | 100 | 100 | 100 | 100 | 91.7 |
| 14 Jan | 50 | 100 | 100 | 100 | 100 | 100 |
| 15 Jan | 50 | 100 | 100 | 100 | 100 | 100 |
| 16 Jan | 50 | 100 | 100 | 100 | 100 | 100 |
| 17 Jan | 100 | 100 | 100 | 100 | 100 | 100 |
| 18 Jan | 100 | 100 | 100 | 100 | 100 | 100 |
| 19 Jan | 100 | 100 | 100 | 100 | 100 | 100 |
| 20 Jan | 100 | 100 | 100 | 100 | 100 | 100 |
| 21 Jan | 100 | 100 | 100 | 100 | 100 | 100 |
| 22 Jan | 100 | 100 | 100 | 100 | 100 | 100 |
| 23 Jan | 100 | 100 | 100 | 95.8 | 100 | 100 |
| 24 Jan | 100 | 100 | 100 | 100 | 100 | 100 |
| 25 Jan | 50 | 100 | 100 | 100 | 100 | 100 |
| 26 Jan | 100 | 100 | 100 | 100 | 100 | 100 |
| 27 Jan | 100 | 100 | 100 | 95.8 | 100 | 100 |
| 28 Jan | 100 | 100 | 100 | 79.2 | 100 | 100 |
| 29 Jan | 100 | 100 | 100 | 87.5 | 100 | 100 |
| 30 Jan | 100 | 100 | 100 | 87.5 | 100 | 100 |
| 31 Jan | 100 | 100 | 100 | 62.5 | 100 | 100 |
| 1 Feb | 100 | 100 | 100 | 100 | 100 | 100 |
| 2 Feb | 100 | 100 | 100 | 100 | 100 | 100 |
| 3 Feb | 100 | 100 | 100 | 83.3 | 100 | 100 |
| 4 Feb | 100 | 100 | 100 | 41.7 | 100 | 100 |
| 5 Feb | 100 | 100 | 100 | 62.5 | 100 | 100 |
| 6 Feb | 100 | 100 | 100 | 100 | 100 | 100 |
| 7 Feb | 100 | 100 | 100 | 100 | 100 | 100 |
| 8 Feb | 100 | 100 | 100 | 100 | 100 | 100 |
| 9 Feb | 100 | 100 | 100 | 100 | 100 | 100 |
| 10 Feb | 100 | 50 | 100 | 100 | 100 | 100 |
| 11 Feb | 100 | 50 | 100 | 100 | 95.8 | 100 |
| 12 Feb | 100 | 50 | 100 | 100 | 100 | 100 |
| 13 Feb | 50 | 50 | 100 | 100 | 95.8 | 100 |
| 14 Feb | 50 | 50 | 100 | 100 | 95.8 | 79.2 |
| 15 Feb | 50 | 50 | 100 | 100 | 100 | 100 |
| 16 Feb | 0 | 50 | 100 | 100 | 100 | 100 |
| 17 Feb | 0 | 50 | 100 | 100 | 100 | 75 |
| 18 Feb | 0 | 100 | 100 | 100 | 100 | 100 |
| 19 Feb | 50 | 100 | 100 | 100 | 100 | 100 |
| 20 Feb | 100 | 100 | 100 | 100 | 100 | 100 |
| 21 Feb | 50 | 100 | 100 | 100 | 100 | 100 |
| 22 Feb | 50 | 100 | 100 | 100 | 100 | 100 |
| 23 Feb | 50 | 100 | 100 | 95.8 | 100 | 100 |
| 24 Feb | 50 | 100 | 100 | 100 | 100 | 100 |
| 25 Feb | 50 | 100 | 100 | 100 | 100 | 100 |
| 26 Feb | 50 | 100 | 100 | 87.5 | 100 | 100 |
| 27 Feb | 50 | 100 | 100 | 100 | 95.8 | 100 |
| 28 Feb | 50 | 100 | 50 | 100 | 100 | 100 |
| 29 Feb | — | — | — | — | — | — |
| 1 Mar | 50 | 100 | 50 | 100 | 100 | 100 |
| 2 Mar | 100 | 100 | 50 | 100 | 100 | 100 |
| 3 Mar | 100 | 100 | 100 | 83.3 | 100 | 100 |
| 4 Mar | 50 | 100 | 100 | 100 | 79.2 | 100 |
| 5 Mar | 50 | 100 | 100 | 100 | 100 | 100 |
| 6 Mar | 50 | 100 | 100 | 100 | 100 | 100 |
| 7 Mar | 100 | 100 | 100 | 100 | 100 | 100 |
| 8 Mar | 100 | 100 | 100 | 100 | 100 | 100 |
| 9 Mar | 100 | 100 | 100 | 100 | 95.8 | 100 |
| 10 Mar | 100 | 100 | 100 | 100 | 100 | 100 |
| 11 Mar | 100 | 100 | 100 | 100 | 100 | 100 |
| 12 Mar | 100 | 100 | 100 | 100 | 100 | 100 |
| 13 Mar | 100 | 100 | 100 | 100 | 100 | 100 |
| 14 Mar | 100 | 100 | 100 | 100 | 100 | 100 |
| 15 Mar | 100 | 100 | 100 | 100 | 100 | 100 |
| 16 Mar | 100 | 100 | 100 | 100 | 100 | 100 |
| 17 Mar | 100 | 100 | 100 | 100 | 100 | 100 |
| 18 Mar | 100 | 100 | 100 | 100 | 100 | 100 |
| 19 Mar | 100 | 100 | 100 | 100 | 100 | 100 |
| 20 Mar | 100 | 100 | 100 | 100 | 100 | 100 |
| 21 Mar | 100 | 100 | 100 | 100 | 100 | 100 |
| 22 Mar | 100 | 100 | 100 | 100 | 100 | 100 |
| 23 Mar | 100 | 100 | 100 | 100 | 100 | 100 |
| 24 Mar | 100 | 100 | 100 | 100 | 100 | 100 |
| 25 Mar | 100 | 100 | 100 | 100 | 100 | 100 |
| 26 Mar | 100 | 100 | 100 | 100 | 100 | 100 |
| 27 Mar | 100 | 100 | 100 | 100 | 100 | 100 |
| 28 Mar | 100 | 100 | 100 | 100 | 100 | 100 |
| 29 Mar | 100 | 100 | 100 | 100 | 100 | 100 |
| 30 Mar | 100 | 100 | 100 | 100 | 100 | 100 |
| 31 Mar | 100 | 100 | 100 | 100 | 100 | 91.7 |
| 1 Apr | 100 | 100 | 100 | 100 | 100 | 100 |
| 2 Apr | 100 | 100 | 100 | 100 | 100 | 100 |
| 3 Apr | 100 | 100 | 100 | 100 | 100 | 100 |
| 4 Apr | 100 | 100 | 100 | 100 | 100 | 100 |
| 5 Apr | 100 | 100 | 100 | 100 | 100 | 100 |
| 6 Apr | 100 | 100 | 100 | 100 | 100 | 100 |
| 7 Apr | 100 | 100 | 100 | 70.8 | 75 | 100 |
| 8 Apr | 100 | 100 | 100 | 100 | 100 | 100 |
| 9 Apr | 100 | 100 | 100 | 100 | 100 | 100 |
| 10 Apr | 100 | 100 | 100 | 100 | 100 | 100 |
| 11 Apr | 100 | 100 | 100 | 100 | 100 | 100 |
| 12 Apr | 100 | 100 | 100 | 95.8 | 100 | 87.5 |
| 13 Apr | 100 | 100 | 100 | 100 | 100 | 75 |
| 14 Apr | 100 | 100 | 100 | 100 | 100 | 100 |
| 15 Apr | 100 | 50 | 100 | 100 | 100 | 100 |
| 16 Apr | 100 | 50 | 100 | 100 | 100 | 100 |
| 17 Apr | 100 | 50 | 100 | 66.7 | 100 | 100 |
| 18 Apr | 100 | 50 | 100 | 100 | 100 | 95.8 |
| 19 Apr | 100 | 50 | 100 | 62.5 | 100 | 100 |
| 20 Apr | 100 | 50 | 100 | 66.7 | 100 | 95.8 |
| 21 Apr | 100 | 50 | 100 | 100 | 100 | 100 |
| 22 Apr | 100 | 50 | 100 | 100 | 100 | 100 |
| 23 Apr | 100 | 100 | 100 | 100 | 100 | 100 |
| 24 Apr | 100 | 100 | 50 | 100 | 100 | 75 |
| 25 Apr | 100 | 100 | 50 | 100 | 100 | 100 |
| 26 Apr | 100 | 100 | 50 | 100 | 100 | 100 |
| 27 Apr | 100 | 100 | 100 | 100 | 100 | 100 |
| 28 Apr | 100 | 100 | 100 | 100 | 100 | 100 |
| 29 Apr | 100 | 100 | 100 | 100 | 100 | 100 |
| 30 Apr | 100 | 100 | 100 | 100 | 100 | 100 |
| 1 May | 100 | 100 | 100 | 100 | 100 | 95.8 |
| 2 May | 100 | 100 | 100 | 100 | 100 | 95.8 |
| 3 May | 100 | 100 | 100 | 100 | 100 | 100 |
| 4 May | 100 | 100 | 100 | 100 | 100 | 95.8 |
| 5 May | 100 | 100 | 100 | 100 | 100 | 95.8 |
| 6 May | 100 | 100 | 100 | 100 | 100 | 100 |
| 7 May | 100 | 100 | 100 | 100 | 100 | 100 |
| 8 May | 100 | 100 | 100 | 100 | 100 | 100 |
| 9 May | 100 | 100 | 100 | 100 | 100 | 100 |
| 10 May | 100 | 100 | 100 | 100 | 100 | 100 |
| 11 May | 100 | 100 | 100 | 100 | 100 | 100 |
| 12 May | 100 | 100 | 100 | 100 | 100 | 100 |
| 13 May | 100 | 100 | 100 | 100 | 100 | 100 |
| 14 May | 100 | 100 | 100 | 100 | 100 | 100 |
| 15 May | 100 | 100 | 100 | 100 | 100 | 100 |
| 16 May | 100 | 100 | 100 | 100 | 100 | 100 |
| 17 May | 100 | 100 | 100 | 100 | 100 | 100 |
| 18 May | 100 | 100 | 100 | 95.8 | 100 | 100 |
| 19 May | 100 | 100 | 100 | 100 | 100 | 91.7 |
| 20 May | 100 | 100 | 100 | 100 | 100 | 100 |
| 21 May | 100 | 100 | 100 | 100 | 100 | 100 |
| 22 May | 100 | 100 | 100 | 100 | 100 | 100 |
| 23 May | 100 | 100 | 100 | 100 | 100 | 100 |
| 24 May | 100 | 100 | 100 | 100 | 100 | 100 |
| 25 May | 100 | 100 | 100 | 100 | 100 | 100 |
| 26 May | 100 | 100 | 100 | 100 | 100 | 100 |
| 27 May | 100 | 100 | 100 | 100 | 100 | 100 |
| 28 May | 100 | 100 | 100 | 100 | 100 | 100 |
| 29 May | 100 | 100 | 100 | 100 | 100 | 100 |
| 30 May | 100 | 100 | 50 | 100 | 100 | 100 |
| 31 May | 100 | 100 | 50 | 100 | 100 | 100 |
| 1 Jun | 100 | 100 | 100 | 100 | 100 | 100 |
| 2 Jun | 100 | 100 | 100 | 100 | 100 | 100 |
| 3 Jun | 100 | 100 | 100 | 100 | 100 | 100 |
| 4 Jun | 100 | 0 | 100 | 100 | 100 | 100 |
| 5 Jun | 100 | 50 | 100 | 100 | 100 | 100 |
| 6 Jun | 100 | 100 | 100 | 100 | 100 | 100 |
| 7 Jun | 100 | 100 | 100 | 100 | 100 | 100 |
| 8 Jun | 100 | 100 | 100 | 95.8 | 100 | 100 |
| 9 Jun | 100 | 100 | 100 | 100 | 100 | 100 |
| 10 Jun | 100 | 100 | 100 | 100 | 100 | 100 |
| 11 Jun | 100 | 100 | 100 | 100 | 100 | 100 |
| 12 Jun | 100 | 100 | 100 | 100 | 100 | 100 |
| 13 Jun | 100 | 100 | 100 | 100 | 100 | 100 |
| 14 Jun | 100 | 100 | 100 | 100 | 100 | 100 |
| 15 Jun | 100 | 100 | 100 | 100 | 95.8 | 100 |
| 16 Jun | 100 | 100 | 100 | 100 | 100 | 100 |
| 17 Jun | 100 | 100 | 100 | 100 | 91.7 | 100 |
| 18 Jun | 100 | 100 | 100 | 100 | 70.8 | 100 |
| 19 Jun | 100 | 100 | 100 | 79.2 | 100 | 100 |
| 20 Jun | 100 | 100 | 100 | 75 | 100 | 100 |
| 21 Jun | 100 | 100 | 100 | 100 | 100 | 100 |
| 22 Jun | 100 | 100 | 100 | 100 | 100 | 100 |
| 23 Jun | 100 | 100 | 100 | 95.8 | 100 | 100 |
| 24 Jun | 100 | 100 | 100 | 100 | 100 | 100 |
| 25 Jun | 100 | 100 | 100 | 100 | 100 | 100 |
| 26 Jun | 100 | 100 | 100 | 100 | 100 | 87.5 |
| 27 Jun | 100 | 100 | 100 | 100 | 100 | 100 |
| 28 Jun | 100 | 50 | 100 | 100 | 100 | 62.5 |
| 29 Jun | 100 | 50 | 100 | 100 | 87.5 | 66.7 |
| 30 Jun | 100 | 50 | 100 | 100 | 87.5 | 79.2 |
| 1 Jul | 100 | 50 | 100 | 100 | 100 | 79.2 |
| 2 Jul | 100 | 50 | 100 | 100 | 70.8 | 66.7 |
| 3 Jul | 100 | 50 | 100 | 95.8 | 54.2 | 79.2 |
| 4 Jul | 100 | 50 | 100 | 100 | 62.5 | 66.7 |
| 5 Jul | 100 | 50 | 100 | 100 | 79.2 | 75 |
| 6 Jul | 100 | 50 | 100 | 100 | 91.7 | 66.7 |
| 7 Jul | 100 | 50 | 100 | 100 | 66.7 | 91.7 |
| 8 Jul | 100 | 50 | 100 | 100 | 100 | 100 |
| 9 Jul | 100 | 100 | 100 | 62.5 | 100 | 83.3 |
| 10 Jul | 100 | 100 | 100 | 70.8 | 100 | 66.7 |
| 11 Jul | 100 | 100 | 100 | 100 | 66.7 | 100 |
| 12 Jul | 100 | 100 | 100 | 100 | 100 | 100 |
| 13 Jul | 100 | 50 | 100 | 100 | 91.7 | 100 |
| 14 Jul | 100 | 100 | 100 | 100 | 91.7 | 100 |
| 15 Jul | 100 | 100 | 100 | 100 | 100 | 100 |
| 16 Jul | 100 | 100 | 100 | 100 | 100 | 100 |
| 17 Jul | 100 | 100 | 100 | 100 | 83.3 | 100 |
| 18 Jul | 100 | 100 | 100 | 100 | 100 | 83.3 |
| 19 Jul | 100 | 100 | 100 | 83.3 | 100 | 66.7 |
| 20 Jul | 100 | 100 | 100 | 100 | 100 | 91.7 |
| 21 Jul | 100 | 100 | 100 | 100 | 70.8 | 95.8 |
| 22 Jul | 100 | 100 | 100 | 100 | 83.3 | 54.2 |
| 23 Jul | 100 | 100 | 100 | 100 | 91.7 | 62.5 |
| 24 Jul | 100 | 100 | 0 | 100 | 62.5 | 58.3 |
| 25 Jul | 100 | 100 | 100 | 100 | 41.7 | 62.5 |
| 26 Jul | 100 | 100 | 100 | 100 | 37.5 | 41.7 |
| 27 Jul | 100 | 100 | 100 | 100 | 58.3 | 54.2 |
| 28 Jul | 100 | 100 | 100 | 100 | 29.2 | 45.8 |
| 29 Jul | 100 | 100 | 100 | 100 | 62.5 | 45.8 |
| 30 Jul | 100 | 100 | 100 | 95.8 | 33.3 | 50 |
| 31 Jul | 100 | 100 | 100 | 83.3 | 58.3 | 66.7 |
| 1 Aug | 100 | 100 | 100 | 100 | 87.5 | 100 |
| 2 Aug | 100 | 100 | 100 | 100 | 100 | 100 |
| 3 Aug | 100 | 100 | 100 | 29.2 | 54.2 | 70.8 |
| 4 Aug | 100 | 100 | 100 | 50 | 54.2 | 62.5 |
| 5 Aug | 100 | 100 | 100 | 66.7 | 54.2 | 20.8 |
| 6 Aug | 50 | 100 | 100 | 37.5 | 54.2 | 66.7 |
| 7 Aug | 100 | 100 | 100 | 16.7 | 62.5 | 83.3 |
| 8 Aug | 100 | 100 | 100 | 50 | 66.7 | 91.7 |
| 9 Aug | 100 | 100 | 100 | 62.5 | 100 | 62.5 |
| 10 Aug | 100 | 100 | 100 | 100 | 87.5 | 41.7 |
| 11 Aug | 100 | 100 | 100 | 100 | 62.5 | 37.5 |
| 12 Aug | 100 | 100 | 100 | 100 | 70.8 | 58.3 |
| 13 Aug | 100 | 100 | 100 | 100 | 91.7 | 66.7 |
| 14 Aug | 100 | 100 | 100 | 100 | 100 | 70.8 |
| 15 Aug | 100 | 100 | 50 | 87.5 | 100 | 83.3 |
| 16 Aug | 100 | 100 | 50 | 58.3 | 100 | 100 |
| 17 Aug | 100 | 100 | 50 | 58.3 | 100 | 100 |
| 18 Aug | 100 | 100 | 50 | 54.2 | 79.2 | 83.3 |
| 19 Aug | 100 | 100 | 50 | 70.8 | 100 | 100 |
| 20 Aug | 100 | 100 | 50 | 100 | 100 | 95.8 |
| 21 Aug | 100 | 100 | 50 | 100 | 100 | 100 |
| 22 Aug | 100 | 100 | 50 | 100 | 100 | 100 |
| 23 Aug | 100 | 100 | 50 | 100 | 100 | 100 |
| 24 Aug | 100 | 100 | 50 | 100 | 100 | 100 |
| 25 Aug | 100 | 100 | 50 | 100 | 100 | 62.5 |
| 26 Aug | 100 | 100 | 50 | 75 | 58.3 | 58.3 |
| 27 Aug | 100 | 100 | 50 | 91.7 | 12.5 | 66.7 |
| 28 Aug | 100 | 100 | 50 | 83.3 | 54.2 | 100 |
| 29 Aug | 100 | 100 | 50 | 66.7 | 33.3 | 100 |
| 30 Aug | 100 | 100 | 50 | 70.8 | 20.8 | 100 |
| 31 Aug | 100 | 100 | 50 | 83.3 | 62.5 | 100 |
| 1 Sep | 100 | 100 | 50 | 100 | 87.5 | 100 |
| 2 Sep | 100 | 100 | 100 | 100 | 100 | 95.8 |
| 3 Sep | 100 | 100 | 100 | 100 | 100 | 66.7 |
| 4 Sep | 100 | 100 | 100 | 100 | 79.2 | 100 |
| 5 Sep | 100 | 100 | 100 | 79.2 | 66.7 | 70.8 |
| 6 Sep | 100 | 100 | 100 | 66.7 | 100 | 87.5 |
| 7 Sep | 100 | 100 | 100 | 100 | 79.2 | 100 |
| 8 Sep | 100 | 100 | 50 | 100 | 100 | 83.3 |
| 9 Sep | 100 | 100 | 50 | 100 | 100 | 100 |
| 10 Sep | 100 | 100 | 50 | 100 | 100 | 100 |
| 11 Sep | 100 | 100 | 50 | 100 | 100 | 87.5 |
| 12 Sep | 100 | 100 | 50 | 100 | 100 | 70.8 |
| 13 Sep | 100 | 100 | 50 | 95.8 | 100 | 66.7 |
| 14 Sep | 100 | 100 | 100 | 100 | 100 | 70.8 |
| 15 Sep | 100 | 100 | 100 | 100 | 100 | 100 |
| 16 Sep | 100 | 100 | 100 | 100 | 100 | 100 |
| 17 Sep | 100 | 100 | 100 | 100 | 100 | 100 |
| 18 Sep | 100 | 100 | 100 | 100 | 100 | 100 |
| 19 Sep | 100 | 100 | 100 | 100 | 100 | 83.3 |
| 20 Sep | 100 | 100 | 100 | 100 | 100 | 87.5 |
| 21 Sep | 50 | 100 | 100 | 100 | 100 | 100 |
| 22 Sep | 50 | 100 | 100 | 100 | 100 | 100 |
| 23 Sep | 50 | 100 | 100 | 100 | 100 | 100 |
| 24 Sep | 50 | 100 | 100 | 100 | 100 | 100 |
| 25 Sep | 100 | 50 | 100 | 100 | 100 | 100 |
| 26 Sep | 100 | 50 | 100 | 100 | 100 | 100 |
| 27 Sep | 100 | 50 | 100 | 100 | 100 | 70.8 |
| 28 Sep | 100 | 100 | 100 | 100 | 83.3 | 83.3 |
| 29 Sep | 100 | 100 | 100 | 100 | 66.7 | 70.8 |
| 30 Sep | 100 | 100 | 100 | 100 | 100 | 70.8 |
| 1 Oct | 100 | 100 | 100 | 100 | 100 | 79.2 |
| 2 Oct | 100 | 100 | 100 | 100 | 100 | 87.5 |
| 3 Oct | 100 | 100 | 100 | 100 | 100 | 100 |
| 4 Oct | 100 | 100 | 100 | 100 | 100 | 100 |
| 5 Oct | 100 | 100 | 100 | 100 | 100 | 100 |
| 6 Oct | 100 | 100 | 100 | 100 | 100 | 100 |
| 7 Oct | 100 | 100 | 100 | 100 | 100 | 100 |
| 8 Oct | 100 | 100 | 100 | 100 | 100 | 100 |
| 9 Oct | 100 | 100 | 100 | 100 | 100 | 100 |
| 10 Oct | 100 | 100 | 100 | 100 | 100 | 100 |
| 11 Oct | 100 | 100 | 100 | 100 | 100 | 75 |
| 12 Oct | 100 | 100 | 100 | 100 | 83.3 | 87.5 |
| 13 Oct | 100 | 100 | 100 | 100 | 41.7 | 83.3 |
| 14 Oct | 100 | 100 | 100 | 100 | 66.7 | 100 |
| 15 Oct | 100 | 100 | 100 | 83.3 | 100 | 100 |
| 16 Oct | 100 | 100 | 100 | 79.2 | 83.3 | 100 |
| 17 Oct | 100 | 100 | 100 | 100 | 100 | 100 |
| 18 Oct | 100 | 100 | 100 | 100 | 100 | 100 |
| 19 Oct | 100 | 100 | 100 | 100 | 100 | 100 |
| 20 Oct | 100 | 100 | 100 | 100 | 100 | 87.5 |
| 21 Oct | 100 | 100 | 100 | 95.8 | 100 | 91.7 |
| 22 Oct | 100 | 100 | 100 | 95.8 | 100 | 70.8 |
| 23 Oct | 100 | 100 | 100 | 100 | 87.5 | 100 |
| 24 Oct | 100 | 100 | 100 | 100 | 100 | 95.8 |
| 25 Oct | 100 | 100 | 100 | 100 | 100 | 100 |
| 26 Oct | 100 | 100 | 100 | 100 | 100 | 100 |
| 27 Oct | 100 | 100 | 100 | 100 | 100 | 100 |
| 28 Oct | 100 | 100 | 100 | 100 | 100 | 100 |
| 29 Oct | 100 | 100 | 100 | 100 | 100 | 100 |
| 30 Oct | 100 | 100 | 100 | 100 | 100 | 100 |
| 31 Oct | 100 | 100 | 100 | 100 | 100 | 100 |
| 1 Nov | 100 | 100 | 100 | 100 | 100 | 100 |
| 2 Nov | 100 | 100 | 100 | 100 | 100 | 100 |
| 3 Nov | 100 | 100 | 100 | 100 | 100 | 95.8 |
| 4 Nov | 100 | 100 | 100 | 100 | 100 | 100 |
| 5 Nov | 100 | 100 | 100 | 100 | 100 | 100 |
| 6 Nov | 100 | 100 | 100 | 100 | 100 | 95.8 |
| 7 Nov | 100 | 100 | 100 | 100 | 100 | 100 |
| 8 Nov | 100 | 100 | 100 | 100 | 100 | 100 |
| 9 Nov | 100 | 100 | 100 | 100 | 100 | 100 |
| 10 Nov | 100 | 100 | 100 | 100 | 100 | 100 |
| 11 Nov | 100 | 100 | 100 | 100 | 100 | 100 |
| 12 Nov | 100 | 100 | 100 | 100 | 100 | 100 |
| 13 Nov | 100 | 100 | 100 | 100 | 100 | 100 |
| 14 Nov | 100 | 100 | 100 | 100 | 100 | 100 |
| 15 Nov | 100 | 100 | 100 | 100 | 100 | 100 |
| 16 Nov | 100 | 100 | 100 | 95.8 | 100 | 100 |
| 17 Nov | 50 | 100 | 100 | 100 | 100 | 100 |
| 18 Nov | 50 | 100 | 100 | 95.8 | 100 | 100 |
| 19 Nov | 100 | 100 | 100 | 100 | 100 | 100 |
| 20 Nov | 100 | 100 | 100 | 100 | 100 | 100 |
| 21 Nov | 100 | 100 | 100 | 100 | 100 | 100 |
| 22 Nov | 100 | 100 | 100 | 100 | 100 | 100 |
| 23 Nov | 100 | 100 | 100 | 100 | 100 | 100 |
| 24 Nov | 100 | 100 | 100 | 100 | 100 | 95.8 |
| 25 Nov | 100 | 100 | 100 | 95.8 | 100 | 95.8 |
| 26 Nov | 100 | 100 | 100 | 95.8 | 100 | 100 |
| 27 Nov | 100 | 100 | 100 | 95.8 | 100 | 100 |
| 28 Nov | 100 | 100 | 100 | 95.8 | 100 | 100 |
| 29 Nov | 100 | 100 | 100 | 100 | 100 | 100 |
| 30 Nov | 100 | 100 | 100 | 100 | 100 | 100 |
| 1 Dec | 100 | 100 | 100 | 95.8 | 100 | 100 |
| 2 Dec | 100 | 100 | 100 | 95.8 | 100 | 100 |
| 3 Dec | 100 | 100 | 100 | 95.8 | 100 | 91.7 |
| 4 Dec | 100 | 100 | 100 | 95.8 | 100 | 95.8 |
| 5 Dec | 100 | 100 | 100 | 95.8 | 100 | 95.8 |
| 6 Dec | 100 | 100 | 100 | 95.8 | 100 | 87.5 |
| 7 Dec | 100 | 100 | 100 | 95.8 | 100 | 100 |
| 8 Dec | 100 | 100 | 100 | 95.8 | 100 | 100 |
| 9 Dec | 100 | 100 | 100 | 100 | 100 | 100 |
| 10 Dec | 100 | 100 | 100 | 95.8 | 100 | 100 |
| 11 Dec | 100 | 100 | 100 | 95.8 | 100 | 100 |
| 12 Dec | 100 | 100 | 100 | 95.8 | 100 | 100 |
| 13 Dec | 100 | 100 | 100 | 100 | 100 | 100 |
| 14 Dec | 100 | 100 | 100 | 100 | 100 | 100 |
| 15 Dec | 100 | 100 | 100 | 100 | 100 | 100 |
| 16 Dec | 100 | 100 | 100 | 100 | 100 | 100 |
| 17 Dec | 100 | 100 | 100 | 100 | 100 | 100 |
| 18 Dec | 100 | 100 | 100 | 100 | 100 | 100 |
| 19 Dec | 100 | 100 | 100 | 100 | 100 | 100 |
| 20 Dec | 100 | 100 | 100 | 100 | 100 | 100 |
| 21 Dec | 100 | 100 | 100 | 100 | 100 | 100 |
| 22 Dec | 100 | 100 | 100 | 91.7 | 100 | 95.8 |
| 23 Dec | 100 | 100 | 100 | 91.7 | 95.8 | 95.8 |
| 24 Dec | 100 | 100 | 100 | 79.2 | 87.5 | 91.7 |
| 25 Dec | 100 | 100 | 100 | 91.7 | 100 | 70.8 |
| 26 Dec | 100 | 100 | 100 | 91.7 | 100 | 75 |
| 27 Dec | 100 | 100 | 100 | 91.7 | 95.8 | 83.3 |
| 28 Dec | 100 | 100 | 100 | 62.5 | 79.2 | 87.5 |
| 29 Dec | 100 | 100 | 100 | 87.5 | 87.5 | 54.2 |
| 30 Dec | 100 | 100 | 100 | 100 | 100 | 62.5 |
| 31 Dec | 100 | 100 | 100 | 100 | 100 | 70.8 |
Even against India’s best-performing coal plants, the solar-plus-storage configuration exhibits comparable annual availability but a fundamentally different, and more manageable, failure mode. All three coal plants and all three solar-plus-storage plants exceed the 85 percent annual NAPAF norm (shown as the dashed reference line). The comparison that matters for system planners is not whether each plant meets the annual norm, but how failures manifest when they occur.
Coal availability follows a binary pattern: output is either at or near 100 percent, or drops abruptly to 50 percent or zero when a unit trips, with outages typically lasting 3 to 10 consecutive days (median to 90th percentile, forced outages only, n=5,449; CEA DGR Sub-Report-10, Jun 2024–May 2025) per event. These outages are driven by boiler tube leaks, electrical faults, and coal supply disruptions, and they strike without warning and without seasonal pattern. All three coal plants experienced outage events during the March–June peak demand season: Telangana STPP had 13 days of degraded availability during peak months, including one day at zero output. Nationally, unplanned coal outages are not confined to one benign season: forced-outage capacity is elevated across the hot pre-monsoon and monsoon months, and correlated-failure episodes have struck during peak-demand periods. For example, on 30 May 2024 — the day India’s all-time peak demand of 250 GW was met — more than 30 GW of thermal capacity was offline, of which roughly 24.5 GW was on forced outage (CREA analysis of CEA Daily Outage Reports, 30 May 2024).
To test how much of coal’s unavailability is actually unscheduled, we parsed twelve months of CEA’s Daily Generation Report (Sub-Report-10, June 2024 through May 2025), covering 250 power stations and 722 generating units. The data shows that only 31.5 percent of coal-fleet outage GW-days were planned maintenance. CEA itself classifies the remaining share as either forced (60.6 percent) or “others” (7.9 percent); the latter is typically commercial back-down, where a healthy unit is switched off in response to low system demand. On any given day, India’s coal fleet had an average of 37 GW out of service, of which roughly 22.7 GW was forced-only (approximately 25.6 GW including ``others’’ such as commercial back-down; daily mean over Jun 2024–May 2025).
[green: duplicated in the Appendix A.6 data-source note] These are not failures that planners can schedule around: they correlate fleet-wide through shared rail logistics, shared river basins, and shared grid conditions, and have repeatedly removed tens of gigawatts simultaneously, including during peak-demand events. Coal’s 85 percent NAPAF norm presumes that most outages are planned and schedulable; at 31.5 percent planned against 60.6 percent forced, the data shows the opposite. Appendix A.6 details how broadly CEA defines a forced outage.
Two distinct failure structures are at work here, and the distinction matters for fleet aggregation (Part 2). Coal’s outages combine an idiosyncratic mechanical component (boiler, turbine, and electrical failures), which does diversify across a large fleet, with a common-mode component (shared coal logistics, river basins, heat stress, and grid conditions), which does not — and which is precisely what removes tens of gigawatts simultaneously during peak demand. Solar-plus-storage inverts this structure: its equipment outages are small, granular, and statistically independent across plants (Appendix A.6), while its weather-driven shortfalls, though regionally correlated, are seasonal, forecastable, and concentrated in low-demand night hours. The companion Part 2 paper’s fleet result rests on exactly this asymmetry.
Solar-plus-storage availability dips moderately during monsoon months, when grid demand is below its annual average, and recovers predictably as solar conditions improve. During peak demand months, availability remains at or near 100 percent. The maximum consecutive shortfall across all 100 simulated plant-year scenarios is 43 hours, with a median of 18 hours, compared to coal outage events lasting days to weeks. [green: verbatim duplicate of §5.1] A system planner can anticipate and schedule around monsoon-season dips months in advance; a boiler tube leak offers no such warning.
Figure 9
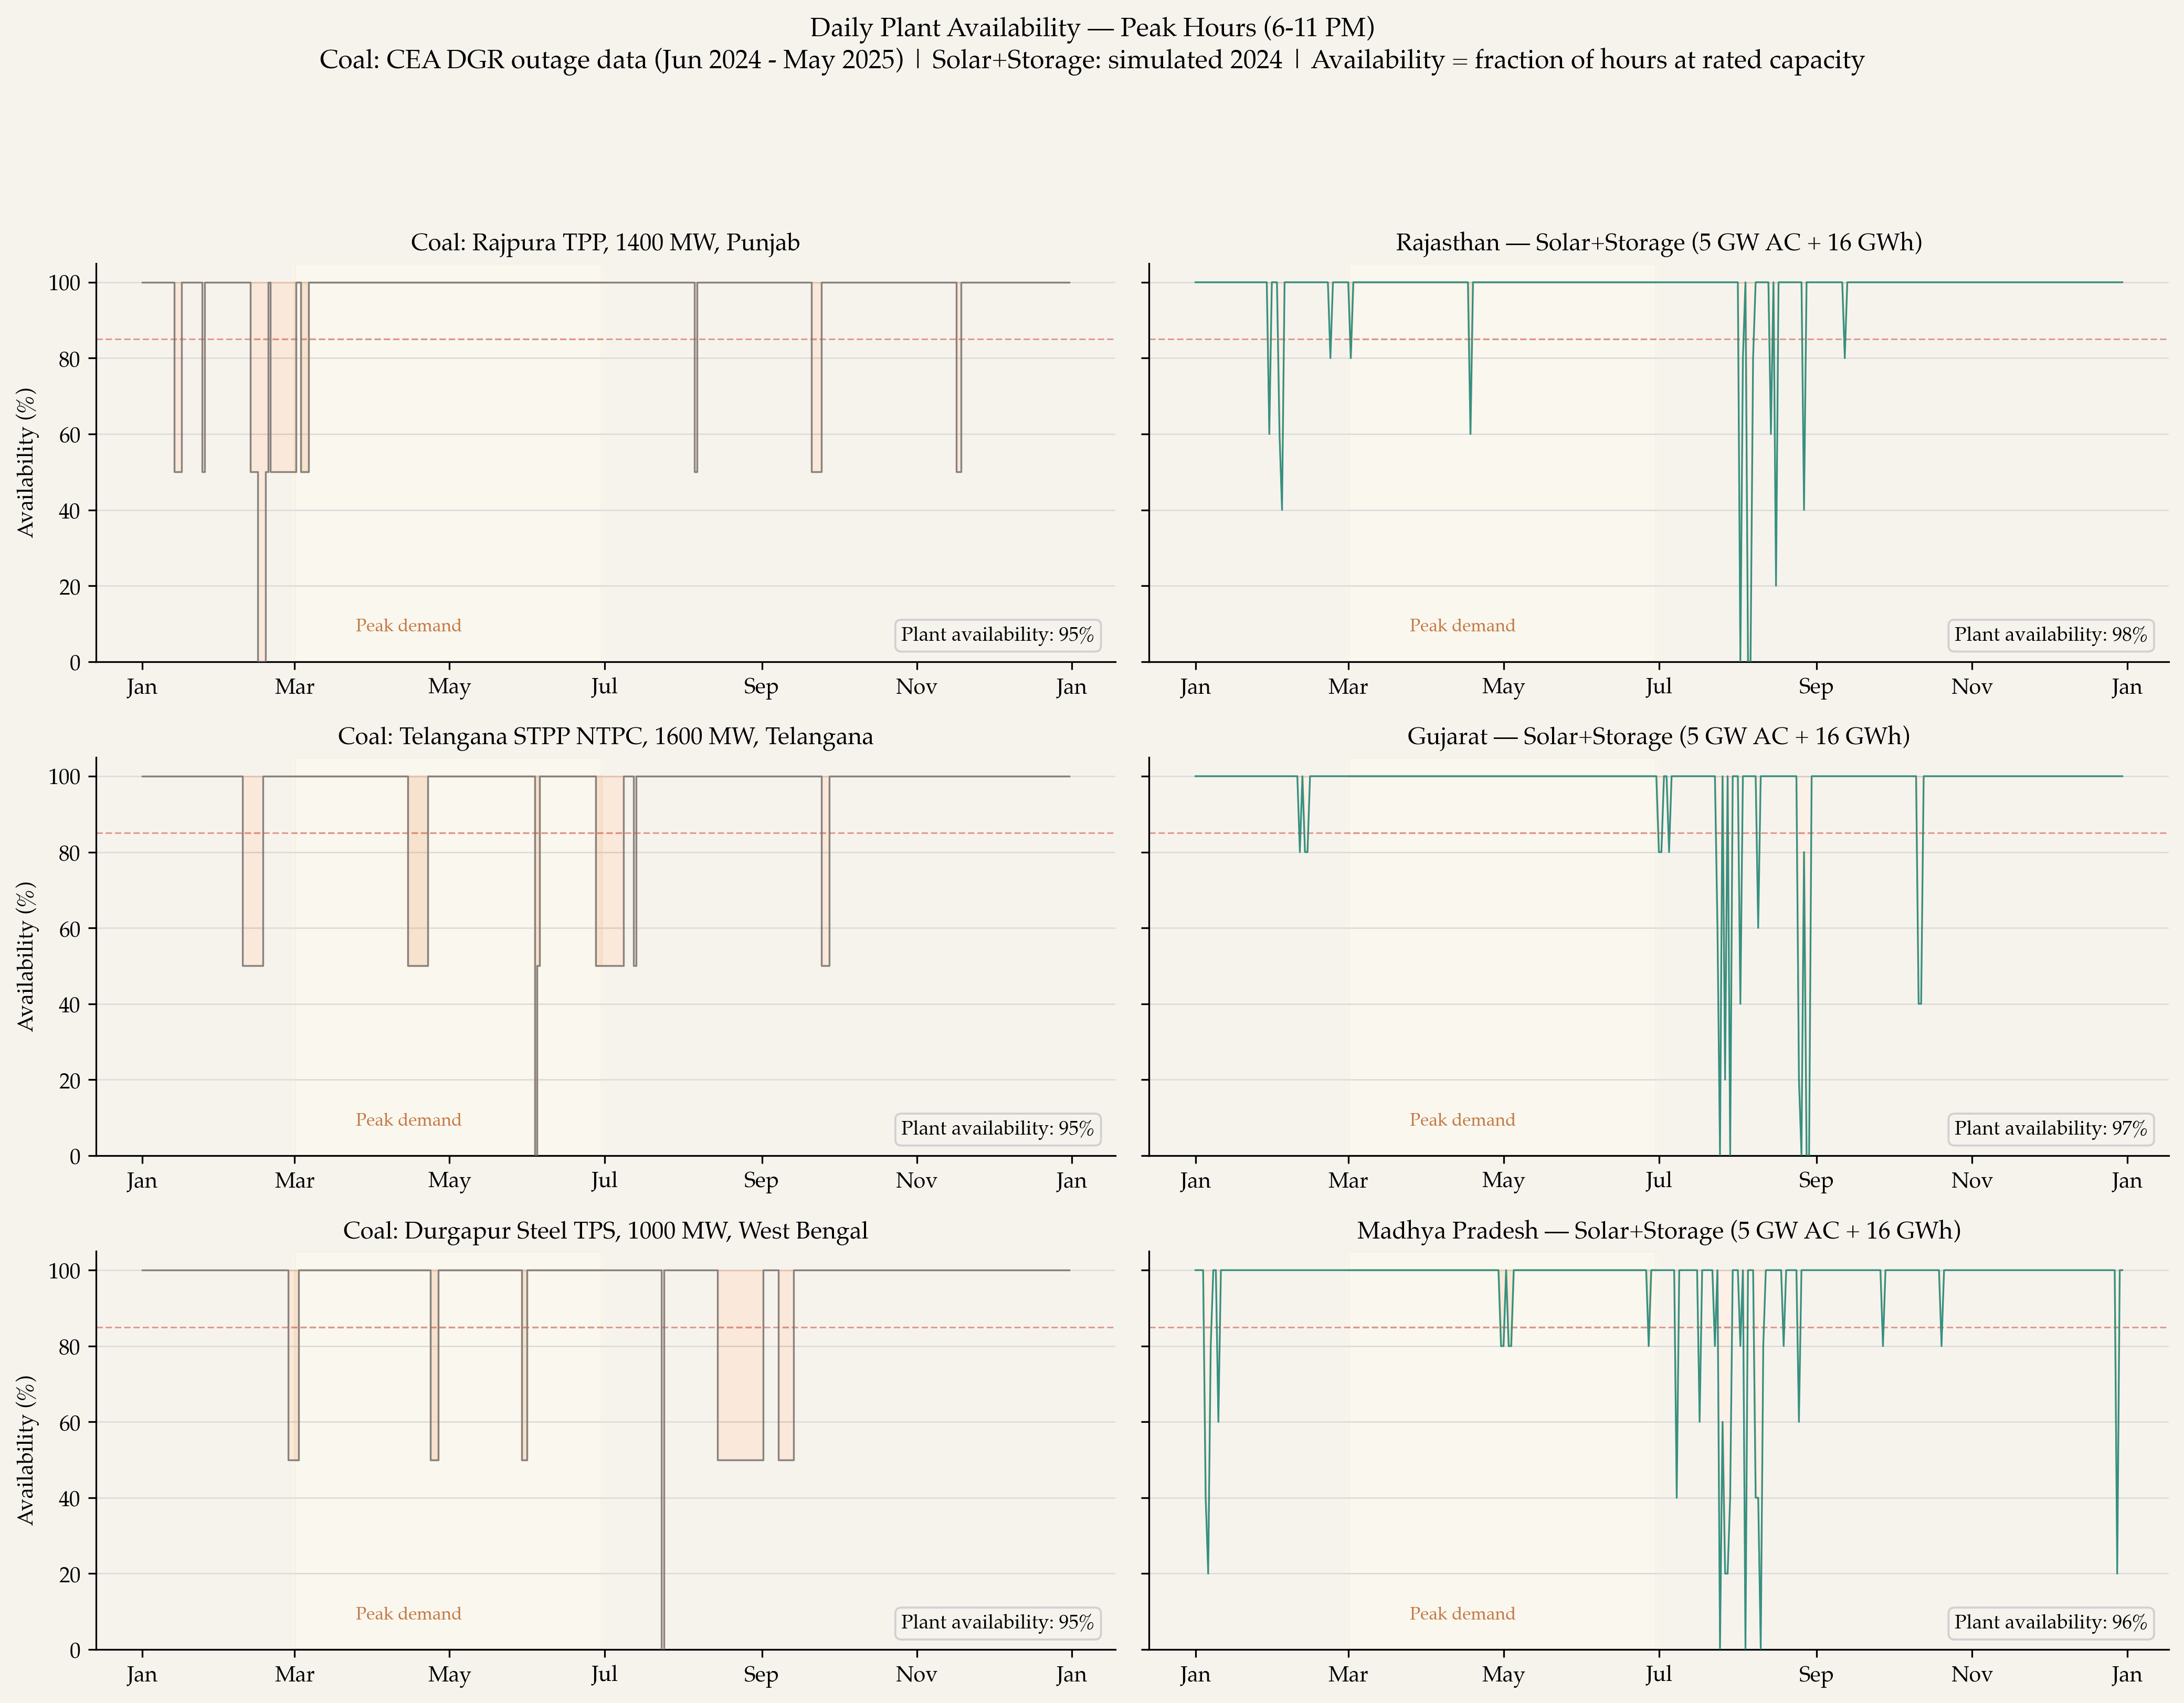
UC BERKELEY ANALYSIS · AUGUST 2026
During peak hours, solar-plus-storage availability is even higher than the 24-hour average at most sites: the battery is fully charged from peak-season solar generation and sustains evening delivery with minimal shortfall. Coal’s peak-hour availability is identical to its daily availability: when a unit trips or enters planned maintenance, it is unavailable for all hours including the evening peak. The fundamental difference in failure mode is clear: solar-plus-storage shortfalls are seasonal, gradual, and concentrated outside peak demand periods; coal failures are abrupt, unpredictable, and strike during peak demand as readily as any other period.
Fleet-wide picture. The plant-level comparison reflects a systemic pattern across the Indian coal fleet. Figure 10 compares actual coal fleet availability by ownership sector against the NAPAF norms.
Figure 10
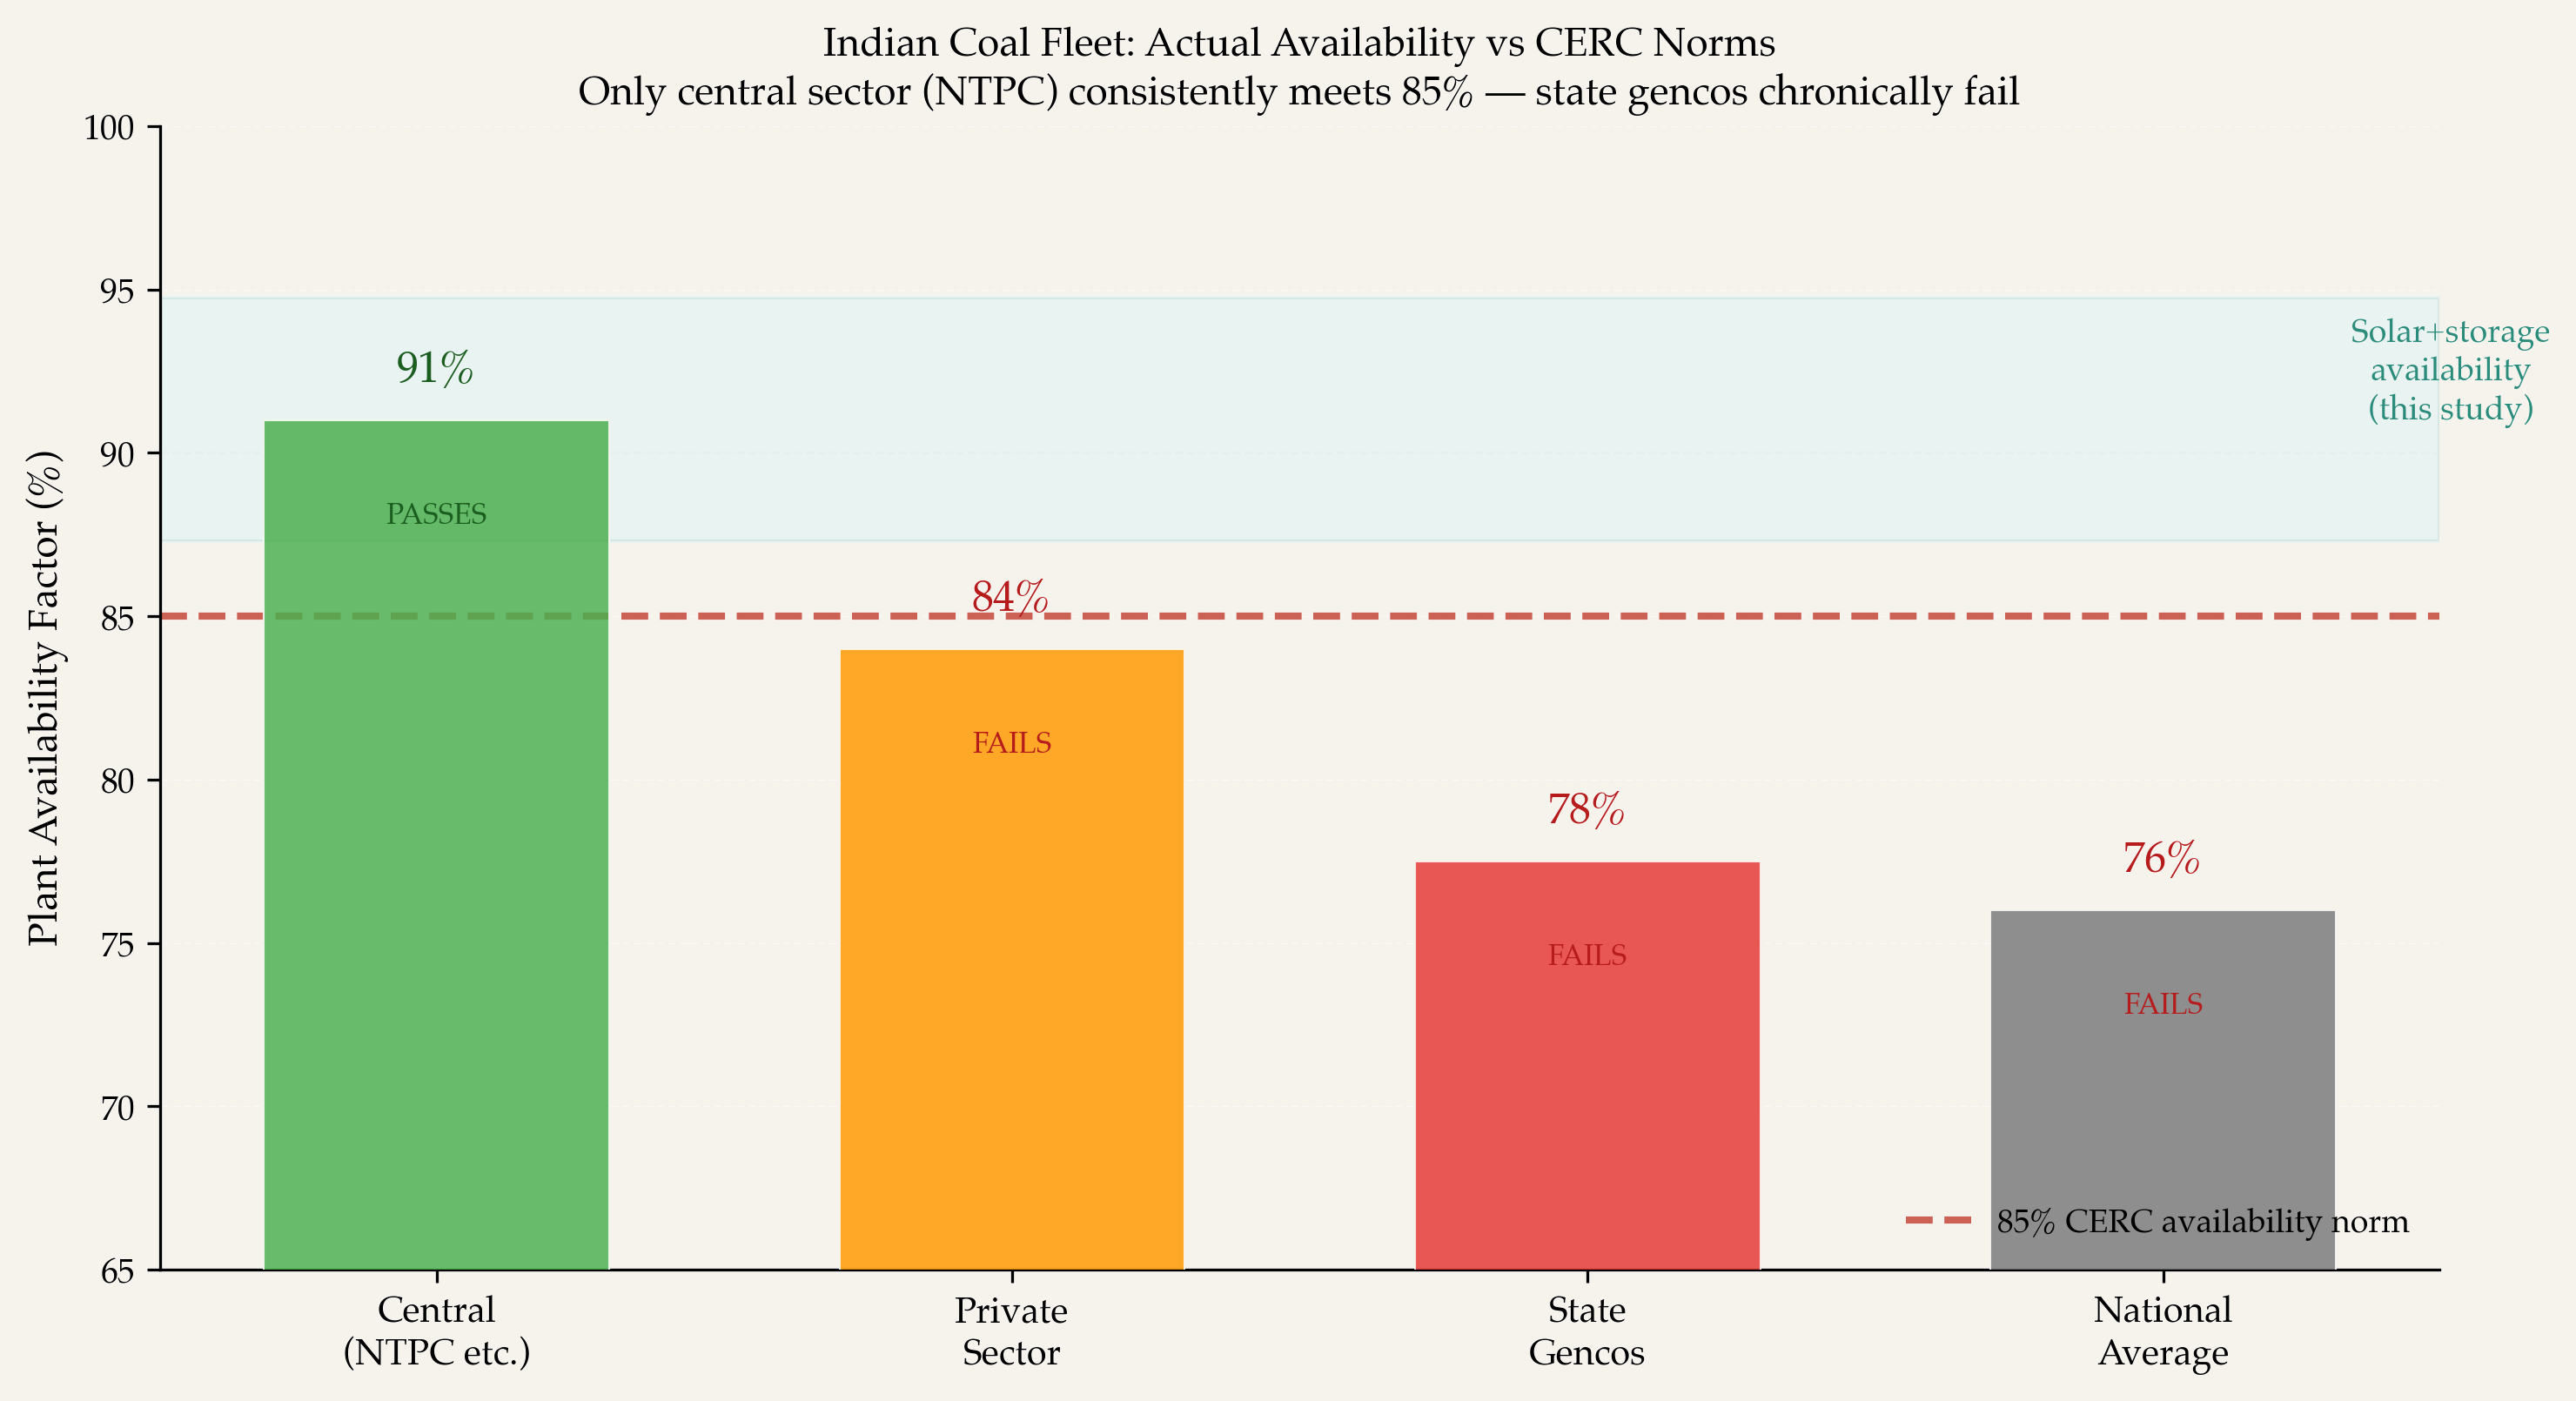
UC BERKELEY ANALYSIS · AUGUST 2026
The sector PAF figures shown in Figure 10 are drawn from CEA’s Performance of Thermal Power Stations reports (CEA, 2024) and CEA’s Executive Summary on Power Sector (CEA, 2025), with the central-sector figure cross-checked against NTPC’s FY24 annual report. They are not derived from the Daily Generation Report outage data parsed elsewhere in this paper, because that dataset does not record per-station rated capacity and therefore cannot itself yield a Plant Availability Factor. Availability by ownership sector:
- Central sector (NTPC and similar): 90–92 percent PAF, consistently exceeding the 85 percent norm
- Private sector: 80–88 percent PAF, mixed compliance
- State generating companies: 75–80 percent PAF typical, with individual gencos spanning 60–88 percent, chronically below the norm
- National average: 76 percent PAF, well below the 85 percent NAPAF target
Penalty mechanisms exist for plants that miss 85 percent availability (proportional capacity charge reduction), but enforcement has been inconsistent, particularly for state-owned generators. At 87–95 percent, the solar-plus-storage configuration modeled here outperforms every coal sector except central-sector NTPC.
5.3 Cost comparison
Table 6 sets out the capital cost build-up for the modeled configuration; Figure 11 carries it through to the all-in levelized cost, against the new coal PPA benchmark.
Table 6: Cost breakdown for the configuration. All values are nominal, unless stated otherwise.
| Component | Value |
|---|---|
| Solar capex | INR 18,750 crore (5.0 GW-AC x INR 3.75 crore/MW-AC) |
| Battery capex | INR 12,942 crore (17.78 GWh nameplate x INR 7,280/kWh; 16 GWh usable at a 10 percent reserve) |
| Solar panel augmentation (PV) | INR 207 crore (35 MW-DC/yr at INR 9,100/kW-DC today; 5 percent/yr nominal price decline) |
| Battery mid-life replacement (PV) | INR 987 crore (year-15 cell replacement at INR 2,319/kWh; 5 percent/yr nominal cell-price decline) |
| Total capex | INR 31,692 crore (capital-recovery base INR 32,886 crore with replacement and augmentation) |
| Fixed O and M | INR 475 crore/yr (1.5 percent of capex) |
| Annual fixed cost | INR 4,098 crore/yr (CRF + O and M + replacement + augmentation) |
| Annual energy delivered | 8,073 GWh (8,322 weather-only, after 3 percent equipment derate; ongoing degradation offset by panel augmentation) |
| Plant-gate LCOE | INR 5.08/kWh |
| All-in with ISTS (out-of-state) | INR 5.83/kWh (range INR 5.58–6.08/kWh) |
Lifecycle accounting lands the plant-gate LCOE at ₹5.08/kWh
Cost bridge from raw energy cost to delivered firm power · ₹/kWh
UC BERKELEY ANALYSIS · AUGUST 2026
View the data table
INR/kWh. New coal ₹5.38–₹6.30, midpoint ₹5.84. All-in range ₹5.58–₹6.08 on transmission charges of ₹0.50–₹1.00.
| Step | Cost family | Change (INR/kWh) | Reported change (INR/kWh) | Running total (INR/kWh) |
|---|---|---|---|---|
| Solar | Solar generation | 2.25 | — | 2.25 |
| + Curtailment & RTE loss | Energy losses | 0.57 | — | 2.82 |
| + Battery storage | Capital additions | 1.75 | — | 4.57 |
| + Min-SOC reserve | Capital additions | 0.2 | 0.19 | 4.77 |
| + Equipment derate (energy) | Energy losses | 0.14 | 0.15 | 4.91 |
| + Solar augmentation | Capital additions | 0.03 | 0.03 | 4.94 |
| + Battery cell replacement | Capital additions | 0.14 | 0.13 | 5.08 |
| Plant-gate LCOE | Cumulative LCOE | — | — | 5.08 |
| + ISTS transmission | Transmission | 0.75 | — | 5.83 |
| All-in LCOE | Cumulative LCOE | — | — | 5.83 |
At a plant-gate LCOE of INR 5.08/kWh (after the lifecycle accounting summarized in Table 6 and Figure 11), the modeled solar-plus-storage RE-RTC configuration is cheaper than the entire range of new coal PPAs priced at INR 5.38–6.30/kWh (midpoint INR 5.84/kWh)2 under comparable availability requirements. At INR 5.08/kWh it sits about 13 percent below the coal midpoint and roughly 6 percent below INR 5.38/kWh, the low end of the range, on a like-for-like bus-bar basis. This means a co-located RE-RTC plant built inside the procuring state, which pays no ISTS charge, delivers firm coal-equivalent power below even the cheapest new coal PPA on a like-for-like bus-bar basis.
If the RE-RTC plant is assumed to be located outside the procuring state and therefore subject to ISTS charges for delivery to the state boundary, the all-in delivered cost rises to INR 5.83/kWh. This is essentially at the midpoint of new coal’s bus-bar tariff range (INR 5.84/kWh) and comfortably below new coal once a like-for-like delivered comparison is made (next paragraph).
That INR 5.83/kWh comparison is conservative: the coal TBCB tariffs of INR 5.38–6.30/kWh are bus-bar generation costs only and exclude ISTS transmission charges. Many new coal plants, particularly central-sector stations, are also located outside the procuring state and incur comparable ISTS charges for delivery. Adding transmission costs of INR 0.50–1.00/kWh to the coal benchmark would raise it to INR 5.88–7.30/kWh (midpoint INR 6.59/kWh); on this fully comparable delivered-cost basis the RE-RTC all-in cost of INR 5.83/kWh is about 12 percent below the coal midpoint and below coal’s delivered range as a whole.
The companion Part 2 paper reports a higher all-in figure, INR 6.36/kWh, for fleet-level firm delivery; the two numbers are consistent and differ by exactly the firmness premium. The INR 5.83/kWh here prices a single plant’s delivered energy (INR 5.08 plant-gate plus INR 0.75 ISTS). Converting 120 such plants into a firm 100 GW flat block adds about INR 0.53/kWh of curtailment-driven firmness cost (INR 5.61 plant-gate plus INR 0.75 ISTS equals INR 6.36/kWh) — still below coal’s like-for-like delivered midpoint of INR 6.59/kWh.
The price structure is fundamentally different. The RE-RTC tariff is flat in nominal terms over the full 25-year PPA tenure: there is no fuel cost pass-through, no coal price escalation, and no foreign exchange exposure. Coal tariffs, by contrast, include a variable fuel component that escalates annually with domestic and imported coal prices.
Applying the most recent CERC-notified domestic-coal escalation of 2.61 percent per year to the fuel component (about 31 percent of the tariff), the effective cost of coal power rises to approximately INR 6.4/kWh by year 10 and INR 7.1/kWh by year 20. Plants that blend imported coal, whose CERC-notified escalation is 4.13 percent per year, or that incur high rail-freight escalation (2.65–8.89 percent depending on haul distance), reach roughly INR 6.7/kWh by year 10 and INR 8.1/kWh by year 203. Over the same period, the RE-RTC tariff remains flat within the INR 5.08–5.83/kWh range.
One may argue that ISTS charges could increase with inflation. Industry expectations are that GNA-based PoC charges could roughly double over the next five years as inter-state transmission build-out accelerates. This escalation applies symmetrically to a new coal IPP serving the same out-of-state load, leaving the relative comparison unchanged. However, only out-of-state RE-RTC plants would incur these charges, a condition that also applies to many new coal plants, including central-sector stations. Moreover, ISTS charges account for less than 15 percent of the all-in delivered cost. Even if they rise with inflation, the impact on total delivered cost remains limited relative to fuel-escalation risk in coal-based generation.
6. Sensitivity, Limitations, and Future Work
Sensitivity. The availability results are robust across 10 weather years (2015–2024), spanning El Nino, La Nina, and neutral years. Every state clears the 85 percent annual threshold in every weather year, with the cross-year standard deviation in availability below 2 percentage points for most states. The cost results are robust to the modeling choices. Varying one assumption at a time (round-trip efficiency, fixed O and M, solar degradation rate, the equipment derate, and battery augmentation), the plant-gate LCOE of INR 5.08/kWh moves only within INR 5.04–5.67/kWh, with the low end set by a higher battery-augmentation credit and the high end by raising O and M to 3 percent of capex per year; an 85 percent round-trip efficiency alone gives INR 5.28/kWh (see Table A2 in Appendix A.5). The durable advantage is structural rather than marginal: the RE-RTC tariff is flat in nominal terms for 25 years, whereas coal escalates with fuel to roughly INR 6.4/kWh within a decade (§5.3).
Limitations. This analysis relies on simulated hourly dispatch using NREL reV utility-PV capacity factors derived from satellite irradiance (NSRDB) rather than empirical generation data from operating plants. While the NSRDB data is well-validated and widely used in the literature, validation against metered output from operational solar and storage plants in India would strengthen the empirical basis for these findings. Additionally, the dispatch algorithm is myopic and rule-based (§4): it simply prioritizes meeting the 1 GW target each hour using available solar and stored energy, with no intra-day optimization or strategic conservation of battery charge for evening peak hours. The 3 percent equipment derating (with 5 percent as a conservative bound) still exceeds the roughly 2 percent forced-outage rate observed for utility-scale solar; the binding term is the battery, at 3–4 percent (Appendix A.6), and each state is represented by a single site. Each of these choices biases against RE-RTC performance, meaning the results are conservative. The companion fleet paper (Part 2) models this same 3 percent rate as an independent per-plant, per-hour stochastic (Bernoulli) outage rather than a flat multiplicative derate, in order to capture the diversification benefit of uncorrelated equipment outages across many plants.
Three caveats temper this conservative framing. First, each state is represented by its highest-resource screened site, reflecting where a developer optimizing for a 25-year availability obligation would build, but a best-case siting choice; a state-average site would lower the headline availability. Second, satellite-derived irradiance (NSRDB) can over- or under-estimate at sub-hourly scales compared with metered plant output, and soiling losses (typically 2–4 percent per year gross in Indian conditions, partly recovered by cleaning) are not modeled separately from the equipment derate; validation against operating Indian plants is a priority for future work. Third, as a capital-intensive asset the configuration is more sensitive to the cost of capital than fuel-heavy coal: a one-to-two-point change in the 10 percent nominal WACC moves the levelized cost more than it moves a coal tariff, so the cost comparison is conditional on the financing terms assumed.
Scope. This paper evaluates a firm, flat round-the-clock block against coal’s plant-availability standard (NAPAF). It does not claim that a single such plant, or solar-plus-storage alone, can serve 100 percent of a system’s seasonally varying demand; that is a separate, whole-system question. The comparison is a like-for-like supply-side substitution: a clean firm block versus a new coal firm block, both of which require the same surrounding peaking and flexibility layer to follow the residual demand shape.
Degradation and end-of-life performance. The cost model includes annual panel augmentation to offset 0.5 percent per year solar degradation, and a year-15 cell replacement to restore the battery to full usable capacity, so the configuration delivers year-1 output throughout the 25-year life. As a stress test, however, we re-ran the dispatch under the alternative assumption that no panel augmentation is performed: solar output then declines to roughly 88 percent of nameplate by year 25. Even in this no-augmentation case, the median equipment-adjusted availability holds at 86.9 percent at year 25, and 77 of the 100 site-years still clear the 85 percent threshold; the highest-resource states (Rajasthan, Gujarat, Jammu and Kashmir, and Tamil Nadu) remain compliant in all ten weather years. The augmentation included in the headline cost is therefore inexpensive insurance, roughly INR 207 crore in PV terms (Table 6), against the marginal-site degradation that would otherwise erode end-of-life performance.
Future work. This paper evaluates individual plants in isolation, deliberately, because the single-site, single-node configuration directly answers coal’s accountability advantage. A natural extension asks whether a geographically distributed fleet of such plants diversifies the residual monsoon-night shortfalls. India’s roughly 3,000 km span crosses largely independent weather systems, and the daily-solar decorrelation distance (about 1,000 km) is well within that span, so cross-state shortfalls should be weakly correlated. In companion work, we find cross-state cross-region failure correlations of 0.01–0.08 across an 18-state fleet (neighbouring states within the same region can correlate at 0.5–0.8), so coordinated portfolio dispatch turns plant-level shortfalls into shallow regional dips. The correlation concern is in any case symmetric: coal outages are themselves strongly common-mode in India (shared coal logistics, monsoon flooding of mines, and heat stress have repeatedly removed tens of gigawatts simultaneously) (§5.2), whereas the solar-plus-storage shortfalls documented here are seasonal, forecastable, and concentrated in low-demand monsoon nights.
7. Conclusion
A single co-located solar-plus-storage plant, comprising 5 GW-AC of solar paired with 16 GWh of usable storage, meets the same availability standard India applies to coal: 85 percent annual availability, with higher availability during the peak-demand months. Across 100 site-year combinations spanning ten Indian states and ten weather years, equipment-adjusted availability has a median of 90.7 percent and every site-year clears the 85 percent annual threshold. Its shortfalls remain seasonal, forecastable, and concentrated in low-demand hours, unlike coal’s abrupt and fleet-correlated forced outages (§5.2).
The failure mode differs fundamentally from coal’s. Solar-plus-storage shortfalls are seasonal, forecastable, and concentrated in low-demand monsoon nights; coal’s forced outages are abrupt, correlated across the fleet through shared logistics and grid conditions, and strike during peak demand as readily as any other period. For a system planner, a shortfall that can be anticipated months in advance is categorically different from a boiler-tube failure that offers no warning.
At INR 5.08/kWh plant-gate and INR 5.83/kWh delivered, against new coal’s INR 6.59/kWh delivered midpoint and rising fuel-linked trajectory, the configuration also undercuts new coal on cost — flat in nominal terms for 25 years.
The remaining barrier to treating renewable round-the-clock power as a credible substitute for new coal is therefore not physics or economics but procurement design: a single tender clause that holds solar-plus-storage to a standard (continuous full availability) that India’s own regulator does not impose on coal. Aligning the renewable round-the-clock availability standard with the one coal actually meets would remove the technical basis for continued new coal procurement.
References
Bloomberg New Energy Finance (BNEF). (2025). Lithium-Ion Battery Price Survey 2025. BloombergNEF.
Central Electricity Authority (CEA). (2024–2025). Daily Generation Report. Ministry of Power, Government of India.
Central Electricity Authority (CEA). (2023). National Electricity Plan, Volume I — Generation, 2022–2032. Ministry of Power, Government of India. Notified 31 May 2023. https://cea.nic.in/wp-content/uploads/irp/2023/05/NEP_2022_32.pdf
Central Electricity Authority (CEA). (2024). Performance of Thermal Power Stations, FY 2023-24. Ministry of Power, Government of India.
Central Electricity Authority (CEA). (2025). Executive Summary on Power Sector, 2024-25. Ministry of Power, Government of India.
NTPC Limited. (2024). Annual Report 2023-24: Operational Performance.
NTPC Renewable Energy Limited (NTPC REL). (2023). Technical Specifications for Solar PV Plant, 1400 MW Grid-Connected Solar PV Projects at Lalitpur and Chitrakoot, Uttar Pradesh.
Central Electricity Regulatory Commission (CERC). (2020). Sharing of Inter-State Transmission Charges and Losses Regulations, 2020.
Central Electricity Regulatory Commission (CERC). (2022). General Network Access (GNA) Regulations, 2022. Notification No. L-1/236/2020/CERC.
Central Electricity Regulatory Commission (CERC). (2024). Terms and Conditions of Tariff Regulations, 2024–29. Notification No. L-1/268/2022/CERC.
Central Electricity Regulatory Commission (CERC). (2026). Annual Escalation Rates for Bid Evaluation, Notification No. Eco-E/2026-CERC, 16 April 2026. Domestic coal 2.61 percent per year; imported coal 4.13 percent per year; inland rail transport 2.65–8.89 percent per year. https://cercind.gov.in/
Centre for Research on Energy and Clean Air (CREA). (2025). Record renewables capacity in FY24-25 signals India’s path beyond coal. https://energyandcleanair.org/publication/record-renewables-capacity-in-fy24-25-signals-indias-path-beyond-coal/
Chojkiewicz, E., Abhyankar, N., and Phadke, A. (2025). Plummeting Solar+Storage Auction Prices in India Unlock Affordable, Inflation-Proof 24/7 Clean Power. India Energy and Climate Center, UC Berkeley Goldman School of Public Policy.
Deline, C., Muller, M., White, R., Perry, K., Springer, M., Deceglie, M., & Jordan, D. (2024). Availability and Performance Loss Factors for U.S. PV Fleet Systems. NREL/TP-5K00-88769. National Renewable Energy Laboratory.
DiOrio, N., Denholm, P., & Hobbs, W. B. (2020). A model for evaluating the configuration and dispatch of photovoltaic plus battery power plants. Applied Energy, 262, 114465.
Electric Reliability Council of Texas (ERCOT). (2025). 2024 ELCC Study Final Report.
Grid Controller of India (Grid-India). (2026). Monthly ISTS Transmission Charges, February 2026 Schedule. https://www.grid-india.in/
ISO New England. (2025). Energy Storage Resource Modeling and Accreditation.
Ministry of Power (MoP). (2016). Notification on Waiver of Inter-State Transmission System Charges and Losses for Solar and Wind Projects.
Ministry of Power (MoP). (2021). Notification on Phased Reduction of ISTS Charge Waivers for Renewable Energy Projects.
Ministry of Power (MoP). (2023). Guidelines for Resource Adequacy Planning and Procurement of Long-Term Firm Power.
Modo Energy. (2024). ERCOT: The Cost of Unavailability for Battery Energy Storage Systems. https://modoenergy.com/research/
National Renewable Energy Laboratory (NREL). (2024). National Solar Radiation Database (NSRDB): India Solar Resource Data. https://nsrdb.nrel.gov/ (Satellite irradiance input underlying the reV utility-PV capacity-factor profiles.)
National Renewable Energy Laboratory (NREL). (2024). Regional Energy Deployment System (ReEDS) Model: Technology Cost and Performance Inputs, 2024 Standard Scenarios. https://www.nrel.gov/analysis/reeds/ (Source of the fixed-tilt utility-PV ``upv-fixed’’ hourly DC-basis capacity-factor profiles, generated via reV/PySAM.)
North American Electric Reliability Corporation (NERC). (2024). 2024 State of Reliability Report. Generating Availability Data System (GADS).
Paliwal, U., Abhyankar, N., & Phadke, A. (2026). Geographic Diversification at Continental Scale (Part 2 of a two-part study on coal-equivalent firm solar in India). India Energy and Climate Center, UC Berkeley Goldman School of Public Policy.
Solar Energy Corporation of India (SECI). (2020–2023). RE-RTC Tender Documents, Tranches I–III.
Solar Energy Corporation of India (SECI). (2025). RTC-IV Tender: Tariff Adoption Order. CERC, November 2025.
Solar Energy Corporation of India (SECI). (2024). Request for Selection for Setting up of 1000 MW/2000 MWh Standalone Battery Energy Storage System (BESS) Projects in India (RfS No. SECI/C&P/IPP/15/0009/24-25, June 2024).
State Electricity Regulatory Commissions (2025–2026). Tariff Adoption Orders for new coal PPAs: AERC adoption order for APDCL–Adani Power Dhubri (22 Oct 2025); BERC Case No. 36 of 2025, BSPGCL–Adani Power Pirpainti (27 Aug 2025); MPERC Petition No. 121 of 2025 (Final Order, 15 Dec 2025), MPPMCL–Torrent Power Anuppur and MPPMCL–Adani Power Anuppur; UPERC Petition No. 2228 of 2025, UPPCL–Adani Power Mirzapur (13 Jan 2026); WBERC Adoption Order, WBSEDCL–JSW Energy Salboni Phase 1 (28 May 2025).
Sungrow. (2024). PowerTitan 3.0 Liquid-Cooled Energy Storage System: Product Datasheet.
Tesla, Inc. (2024). Megapack 2 XL: Product Datasheet.
U.S. Environmental Protection Agency (EPA). (2023). Documentation for EPA’s Power Sector Modeling Platform v6 — Post-IRA 2022 Reference Case, Chapter 4: Generating Resources, Table 4-15. Released April 5, 2023. https://www.epa.gov/system/files/documents/2023-03/Chapter%204%20-%20Generating%20Resources.pdf
Appendix A: Detailed Methodology
A.1 Performance criteria
Based on the regulatory framework described in Section 3, we define three coal-equivalent performance criteria for a 1 GW solar-plus-storage plant:
-
Annual plant availability: The plant must be available to deliver full rated capacity (i.e., 1.0 GW output from a 1 GW plant) in 85 percent or more of all hours in a year. This mirrors the CERC NAPAF norm for coal.
-
Peak month availability: During peak demand months (March through June), the plant must achieve at least 90 percent availability at full rated capacity. Peak-season availability is evaluated over all hours pooled across March through June, not as the minimum of the four individual months.
-
Minimum monthly floor: No individual month may fall below 70 percent availability.
A configuration “passes” the coal-equivalent test only if all three criteria are met simultaneously.
A.2 Plant architecture
The co-located, DC-coupled architecture consists of:
- Target output: 1 GW AC to the grid through a single point of connection
- Solar array: 5 GW AC at a DC-to-AC inverter loading ratio (ILR) of 1.4:1, yielding 7.0 GW DC of installed solar modules (within the range specified in NTPC’s recent utility-scale solar PV tenders, which require ILRs of 1.30 to 1.45 depending on the mounting structure, with a 1.50 technical specification ceiling [NTPC REL, 2023]). The modules are fixed-tilt (the reV ``upv-fixed’’ product); because the hourly profile is expressed as AC output per unit of DC nameplate, it saturates at 1/ILR = 0.714, so the 7.0 GW-DC array delivers a peak AC output of exactly 5.0 GW
- Battery storage: 16 GWh usable (17.78 GWh nameplate at a 10 percent minimum state-of-charge reserve), DC-coupled to the solar array
- Round-trip efficiency: 92 percent (DC-coupled lithium-ion) (net AC-AC round-trip efficiency for a DC-coupled co-located LFP system, applied one-sided on discharge; charging modeled lossless; DiOrio, Denholm & Hobbs 2020 NREL/TP-6A20-75668; Tesla Megapack 2 XL datasheet 2024; Sungrow PowerTitan 3.0 datasheet 2024)
- Dispatch model: Greedy, independent, myopic. Solar output first serves the 1 GW target; any excess charges the battery; when solar falls short, the battery discharges to fill the gap
The reliability simulation and the cost model use one consistent battery: 16 GWh of usable energy above a 10 percent state-of-charge floor (17.78 GWh nameplate). The dispatch draws the usable 16 GWh down to this floor (mathematically identical to a 16 GWh pack drained to empty), so the modeled availability reflects exactly the usable energy the cost model pays for.
The ILR of 1.4:1 is chosen to provide sufficient daily energy margin. At the average DC capacity factor across the 10 states (17.6 percent), the 7.0 GW DC array generates approximately 29.6 GWh per day (7.0 GW x 24 h x 0.176; the 0.176 is a DC-basis capacity factor, i.e. AC output per unit of DC nameplate, so this daily figure already reflects post-clip AC energy at the plant boundary), compared to the delivery target of 24.0 GWh per day (1.0 GW x 24 h). This yields a gross surplus of 23 percent. After accounting for battery round-trip efficiency losses of 8 percent on the roughly 14 GWh of energy cycled through the battery each day, net available energy is approximately 28.5 GWh per day, still 19 percent above the delivery target. This margin absorbs day-to-day weather variability and sustains weather-only availability at approximately 94 percent across the 100 site-year simulations. At the standard Indian ILR of 1.3:1 (6.5 GW DC), daily generation falls to 27.5 GWh, leaving only a 10 percent net surplus after efficiency losses and reducing weather-only availability to approximately 90 percent (simulated via rtc_config_sweep.py across the 18-state pool; 91.9 percent across the 10 target states), barely meeting the 85 percent coal threshold after equipment derating.
Because the plant is co-located, solar generation above the 1 GW grid-export limit (but below the 5 GW-AC solar inverter rating) charges the battery rather than being curtailed at the grid connection; this surplus-to-battery routing is explicitly modeled in the dispatch. A second-order advantage of DC coupling is that DC generation above the 5 GW-AC inverter rating, which an AC-coupled plant would clip at the inverter under a 1.4:1 ILR, can instead be banked on the DC bus (DiOrio et al., 2020). Our solar profile is supplied already AC-clipped at the 1.4:1 ILR (its capacity factor saturates at 1/1.4 = 0.714 of DC nameplate), so the model does not credit this DC-side clip recovery: the forgone energy (roughly 0.5–1.1 percent of annual generation) is un-modeled upside, making the reported availability and cost results slightly conservative rather than optimistic.
This architecture represents the simplest possible design: a single developer builds one plant at one location with one grid connection. Any performance improvement from fleet coordination, demand response, or hybrid wind integration would be additive.
A.3 Solar resource data
Hourly solar capacity-factor profiles are NREL’s reV/ReEDS-India utility-scale PV product (upv-fixed'': a fixed-tilt array at a 1.4:1 inverter loading ratio), reported ascapacity_factor_dc’’ — AC energy output per unit of installed DC nameplate — at approximately 5 km spatial resolution (157,715 grid cells) for each year from 2015 through 2024. Because the ILR is 1.4:1, the hourly value saturates at 1/1.4 = 0.714 (the inverter’s AC limit) on clear days; the underlying irradiance is NSRDB-India (NREL, 2024). These ten complete weather years total 87,600 hours. We select one representative site per state, choosing the highest-capacity-factor location (a 2x2 cell block, approximately 130 km-sq) among the candidate sites in each state that pass land-availability and transmission-proximity screens. The screened candidate pool varies widely by state, from a single qualifying block in Tamil Nadu and only a handful in Madhya Pradesh and Telangana to several thousand in Rajasthan, so the selected site is the best screened option among many, not an unconstrained search over all grid cells. (see Table 4).
The 10 sites used in this paper are a strict subset of the 120-site fleet used in the companion Part 2 paper, which selects sites by maximising a score of 0.70 × normalized developable land area + 0.30 × normalized transmission proximity within each of 18 states (subject to a 2–12 per-state diversity cap, relaxed in a final pass to reach the 120-site total — Rajasthan ends with 36 sites). From that 120-site list (output/selected_sites.csv), we retain the single highest-avg_cf_dc 2×2 block (≈130 km², ≈5 km NSRDB resolution) for each of the 10 states evaluated here. This CF ranking is applied within Part 2’s land- and transmission-screened site list (Part 2’s supply-curve score itself weights land area and transmission proximity, not resource quality), so the single-plant availability and cost reported here are directly inheritable to the corresponding plants in the Part 2 fleet.
A.4 Simulation design
The single configuration (5 GW AC at 1.4:1 ILR = 7.0 GW DC + 16 GWh) is simulated at all 10 sites for all 10 weather years, yielding 100 independent simulations. Each simulation runs the greedy dispatch model over 8,760 hours and computes all performance metrics described in Section A.1.
A.5 Cost model
Table A1: Key cost assumptions
| Parameter | Value | Source / Rationale |
|---|---|---|
| Solar capex | INR 3.75 crore/MW-AC | Industry reported values of INR 3.5–4 Cr/MW and Chojkiewicz et al. (2025) |
| Battery capex | INR 7,280/kWh (DC-coupled co-located system) | Engineering build-up: LFP pack about INR 4,550–5,460/kWh (BNEF 2025) plus DC-coupled BOS, EPC and integration; well below standalone India BESS (INR 10,920–13,195/kWh). Corroborated by (not derived from) recent auctions (Chojkiewicz et al., 2025) |
| Fixed O and M cost | 1.5% of project capex/yr | Industry norms; consistent with O&M components in recent SECI/NTPC RE-RTC and BESS tender documents and with CEA norms for utility-scale solar (approximately INR 5–7 lakh/MW/yr) |
| Weighted Average Cost of Capital (WACC) | 10% (nominal) | Using debt:equity ratio of 80:20 with ROE of 14% and debt cost of 9% |
| Project life | 25 years | Typical PPA tenure in India |
| ISTS transmission charges, including losses | INR 0.50–1.00/kWh (equivalent to INR 3.36 to 6.73 lakh/MW/month at the modeled plant load factor) | Derived from LT-GNA charges of INR 3 to 5 lakh/MW/month (Feb 2026: approximately INR 3.6 lakh) under the PoC mechanism (Grid-India, 2026); range envelopes state-by-state PoC variation and a conservative bound for future indexation |
| New coal PPA prices (for benchmarking) | INR 5.38–6.30/kWh | Range of first-year bus-bar tariffs from recent state TBCB PPAs (see Appendix A.7); excludes ISTS transmission |
Note (FX): FX assumption 91 INR/USD; solar capex is INR-anchored, only battery and augmentation streams scale with FX; at FX=95.7 plant-gate LCOE shifts to INR 5.19/kWh; at FX=92.3 to INR 5.11/kWh.
The solar cost is expressed on an AC basis per Indian convention: INR 3.75 crore/MW-AC includes the cost of DC modules at the 1.4:1 ILR, the AC inverter, balance of system, and grid connection. The cost saving from the DC-coupled architecture (a shared grid-connection and power-conversion stage rather than separate solar and battery inverter trains) is already netted into the headline INR 3.75 crore/MW-AC figure. The battery cost of INR 7,280/kWh reflects an integrated-system cost target for DC-coupled co-located configurations, where solar and battery share DC-bus infrastructure and balance of system; the shared inverter and grid-connection savings are captured separately in the solar AC line and are not re-counted here. Excluding those shared savings, the defensible battery-only discount versus standalone storage (INR 10,920–13,195/kWh) is more modest, on the order of 15–25 percent, so INR 7,280/kWh sits at the optimistic end; a more conservative USD 100/kWh case is reported in Table A2.
The capital recovery factor (CRF) at 10 percent nominal WACC over 25 years is 0.1102. Annual fixed costs equal total capex multiplied by (CRF + O and M rate). LCOE is annual fixed cost divided by actual simulated annual energy delivery. The resulting LCOE is a flat nominal levelized cost, directly comparable to flat nominal PPA tariffs in Indian power procurement.
Four refinements are applied to the headline cost. First, the battery is sized at 17.78 GWh nameplate so that 16 GWh remains usable above a 10 percent minimum state-of-charge reserve. Second, the annual energy denominator is reduced by the same 3 percent equipment forced-outage factor applied to the availability results, so that cost and reliability use one consistent equipment assumption. Third, ongoing solar degradation of 0.5 percent per year is offset by annual panel augmentation rather than treated as a permanent energy loss: roughly 35 MW-DC of new modules are added each year at the prevailing module price (INR 9,100/kW-DC today, declining 5 percent per year nominal), discounted to present value at the project discount rate. Fourth, a mid-life replacement of the battery cells (at year 15) is added on a present-value basis; the cell price declines at the same 5 percent per year nominal rate as solar modules, falling from INR 5,005/kWh today to roughly INR 2,319/kWh by year 15. Together these raise the plant-gate LCOE from INR 4.57 to INR 5.08/kWh; details and a step-by-step bridge are shown in Table 6 and Figure 11.
Transmission cost: We add a full ISTS charge of INR 0.50–1.00/kWh to the plant-gate LCOE, representing the cost a co-located plant would face without any waivers. The underlying tariff is capacity-based (INR 3 to 5 lakh per MW per month under the GNA/PoC mechanism; Feb 2026: approximately INR 3.6 lakh); for a 1 GW plant delivering about 8 TWh per year this translates to roughly INR 0.75/kWh, with the reported range enveloping state-by-state PoC variation and a conservative bound for future indexation. The charge is expressed volumetrically (INR/kWh) only for combination with the levelized energy cost; the underlying tariff would apply identically to a coal IPP serving the same delivery point.
Coal benchmark: We compare against new coal generation procured through tariff-based competitive bidding, with bus-bar generation tariffs (excluding ISTS transmission) of INR 5.38–6.30/kWh.
Table A2: Sensitivity of the plant-gate LCOE to alternative cost assumptions. Each row varies one assumption from the INR 5.08/kWh base. All values in INR/kWh.
| Scenario | Plant-gate LCOE | Δ vs base |
|---|---|---|
| Base case (3% derate, panel augmentation, 5%/yr cell-price decline) | 5.08 | N/A |
| Battery system cost INR 9,100/kWh (USD 100, vs USD 80) | 5.58 | +0.50 |
| Round-trip efficiency 85% (vs 92%) | 5.28 | +0.20 |
| Fixed O and M 3% (vs 1.5%) | 5.67 | +0.59 |
| Solar degradation 0.7%/yr (more augmentation) | 5.09 | +0.01 |
| Solar degradation 0.7%/yr + 2% year-1 light-induced loss | 5.19 | +0.12 |
| Battery augmentation (30% at year 13 at INR 4,550/kWh, vs cell replacement) | 5.04 | −0.04 |
| Equipment derate 5% (conservative bound, vs 3%) | 5.18 | +0.11 |
No single assumption moves the plant-gate LCOE above INR 5.67/kWh (still below the INR 5.84/kWh coal midpoint), and the only rows that exceed the new coal floor of INR 5.38/kWh are the tripled fixed O and M case and the USD 100/kWh battery case. Two of the rows (battery augmentation and the 3 percent central derate vs the 5 percent conservative bound) move the cost down, indicating that some of the central assumptions in this paper are themselves on the conservative side.
A.6 Equipment reliability factors
Solar resource simulations capture weather-driven variability but not equipment forced outages. We apply a forced-outage derate to the weather-only results, adopting 3 percent as a realistic central case and 5 percent as a conservative bound. Because the configuration is DC-coupled (solar and battery share the inverters, DC bus, and grid connection), the binding term is the battery; published battery-availability evidence clusters around 96–97 percent (a 3–4 percent forced-outage rate), which is why we treat 3 percent as the central estimate.
Solar PV: NREL’s fleet-wide field study of utility-scale PV (Deline et al., 2024) reports a mean availability of 97.9 percent and a median of 99.1 percent, implying a forced-outage rate of roughly 1–2 percent. Indian procurement structures solar performance through a minimum declared Capacity Utilization Factor (~21 percent in NTPC and SECI RfS documents; an AC-nameplate utilization figure, not directly comparable to the DC-basis capacity factors in Table 4, whose AC-nameplate equivalents are roughly 23–29 percent) rather than an availability percentage, because solar output is irradiance-bound; equipment-availability targets in Indian tenders apply to dispatchable assets (see battery paragraph below).
Battery storage: Indian procurement targets for dispatchable storage are consistent with the U.S. evidence: SECI’s standalone BESS tenders specify a 95 percent minimum annual availability (e.g., SECI/C&P/IPP/15/0009/24-25, June 2024), and NTPC Green Energy’s Khavda 800 MW/3200 MWh BESS tender specifies 98 percent. Published battery-availability data center on 96–97 percent. The U.S. EPA Integrated Planning Model (Platform v6, Table 4-15) assumes 96.4 percent availability for battery storage (about 3.6 percent forced outage); NREL’s ReEDS capacity-expansion dataset uses 2 percent at the low end; and Modo Energy’s metered ERCOT fleet shows roughly 97 percent realized availability. Higher figures (about 5 percent) appear in resource-adequacy studies (ERCOT, 2025; ISO New England, 2025), which we adopt as the conservative bound. An earlier draft attributed a 5.4 percent battery forced-outage rate to NERC GADS; that value is a CPUC/SERVM resource-adequacy modeling input (CPUC SERVM Workshop 8 outage-rate slides, January 19, 2022), not a NERC measurement, and has been corrected.
Modularity: PV and battery systems fail granularly rather than catastrophically. A single inverter is roughly 3 percent of plant capacity and a single battery container under 1 percent, so a component failure derates output by a small increment rather than tripping the whole plant offline, unlike a coal unit, which trips wholesale. Reflecting this, NREL’s utility-scale PV availability methodology (Deline et al., 2024) records only whole-inverter outages and explicitly excludes partial derates; NERC’s GADS-Solar requires equipment-failure derates above 20 MW to be reported but is otherwise also oriented around unit-level events, because granular derating does not map onto the unit-trip model built for thermal plants. This modularity is the physical basis for treating 3 percent as realistic and 5 percent as conservative.
Equipment-adjusted plant availability is computed as Plant availability = Weather-only availability x (1 - equipment derating). At the 3 percent central derate, a weather-only median of 93.5 percent yields an equipment-adjusted median of 90.7 percent; at the 5 percent conservative bound it is 88.8 percent. For consistency, the same equipment factor is applied to the annual energy used in the cost model (Appendix A.5).
For comparison, U.S. coal fleets report equivalent forced outage rates of about 10–12 percent (NERC, 2024), and the CEA-derived strictly mechanical forced-outage rate for India’s coal fleet is approximately 8 percent (see note below) — in either case several times the 3 percent (5 percent conservative) estimated for solar-plus-storage systems.
A note on coal’s forced outage rate: CEA’s “forced” classification in the Daily Generation Report is broader than NERC’s Equivalent Forced Outage Rate (EFOR). It includes Reserve Shutdown, fuel-supply disruptions, and grid-related back-down (categories that NERC treats as Available or commercial). After stripping these from the CEA data, the strictly mechanical forced outage rate for India’s coal fleet (boiler, turbine-generator, electrical, and milling/fan failures only) is approximately 8 percent (about 17.3 GW out of service daily against roughly 210 GW of installed coal, from CEA DGR Sub-Report-10, Jun 2024–May 2025), broadly comparable to NERC’s reported U.S. coal EFOR of about 12 percent in 2023 (NERC, 2024) and above the 5–7 percent forced-outage margin implicit in CERC’s 85 percent NAPAF norm. CEA’s National Electricity Plan 2022–32 modelling uses a 10 percent forced outage rate assumption for coal, lignite, gas, and nuclear plants (CEA, 2023, NEP 2022–32 Vol-I, Section 5.3.3, p. 141).
A note on the coal data source. Coal availability in Figures 8 and 9 and the 60.6 / 31.5 / 7.9 percent split in Section 5.2 are derived from CEA’s Daily Generation Report Sub-Report-10, which lists unit-level capacity under outage by category. This is distinct from the regional-aggregate Sub-Report-2 and from the daily Declared Capacity values that generators submit to each Regional Power Committee under the Deviation Settlement Mechanism. The three sources are conceptually close but not identical: Declared Capacity is a forward-looking commitment and can understate true availability when a healthy unit is on Reserve Shutdown, while the DGR measure used here is backward-looking. We use Sub-Report-10 because it permits unit-level reconstruction by outage category and is the only nationally consistent public feed across the 250 stations covered.
A.7 New coal PPA benchmark
The INR 5.38–6.30/kWh range used throughout this paper as the new-coal benchmark is the min–max of first-year bus-bar tariffs awarded across six new long-term coal PPAs signed in Uttar Pradesh, Madhya Pradesh, West Bengal, Bihar, and Assam between March and November 2025, aggregating approximately 11.9 GW (Table A3). All are 25-year tenures with variable charges indexed to coal prices.
Decomposed into their regulated two-part tariffs, these six PPAs carry a fixed (capacity) charge averaging INR 4.03/kWh (about 69 percent of the first-year tariff) and a variable (fuel) charge averaging INR 1.78/kWh (about 31 percent); the per-plant split is shown in Table A3. This roughly 31 percent fuel share, not a larger one, is the base to which the coal-price escalation in Section 5.3 is applied. Because all six plants draw domestic linkage (SHAKTI) coal rather than imported coal, the central escalation rate used is the CERC-notified domestic-coal figure of 2.61 percent per year, with the imported-coal rate of 4.13 percent per year shown as an upper bound.
Table A3: New coal PPAs (Mar–Nov 2025) used as the cost benchmark, with their regulated fixed and variable (fuel) charge decomposition; tariff, fixed and fuel charges in INR/kWh.
| State | Plant (Developer) | Cap (MW) | Tariff | Fixed | Fuel | Fuel share (%) |
|---|---|---|---|---|---|---|
| Uttar Pradesh | Mirzapur (Adani) | 1,500 | 5.383 | 3.727 | 1.656 | 31 |
| Madhya Pradesh | Anuppur USC (Torrent) | 1,600 | 5.829 | 4.222 | 1.607 | 28 |
| Madhya Pradesh | Anuppur (Adani) | 1,600 | 5.838 | 4.298 | 1.540 | 26 |
| Madhya Pradesh | Anuppur Phase II (Hindustan Thermal) | 800 | 5.818 | — | — | — |
| West Bengal | Salboni Ph 1 (JSW) | 1,600 | 5.45 | 3.60 | 1.85 | 34 |
| Bihar | Pirpainti (Adani) | 2,400 | 6.075 | 4.165 | 1.910 | 31 |
| Assam | Dhubri (Adani) | 3,200 | 6.300 | 4.16 | 2.14 | 34 |
| Mean (six PPAs) | 5.81 | 4.03 | 1.78 | 31 |
Notes: Fuel share = variable charge divided by first-year tariff. The mean and the INR 5.38–6.30/kWh range are computed over the six benchmark PPAs in Uttar Pradesh, Madhya Pradesh (Adani and Torrent Anuppur), West Bengal, Bihar and Assam; the Hindustan Thermal Anuppur Phase II award (800 MW at INR 5.818/kWh, the L1 of the three 2025 MPPMCL Anuppur awards under MPERC Petition No. 121 of 2025) is shown for completeness and is not included in the six-PPA mean or range; its regulated fixed/fuel split is not separately reported in the order. Decomposition from regulatory adoption orders: Uttar Pradesh from UPERC Petition 2228/2025; both decomposed Madhya Pradesh plants (Adani and Torrent, both at Anuppur) from MPERC Petition No. 121 of 2025 (Final Order, 15 Dec 2025), whose comparative table also reports the West Bengal, Bihar and Assam splits; Bihar from BERC Case No. 36 of 2025 (27 Aug 2025); the Assam fixed charge is from the AERC adoption order with the variable charge derived as tariff minus fixed. JSW Salboni tariff is the levelized rate; first-year bus-bar would be marginally higher. All tariffs are bus-bar and exclude ISTS transmission, and all plants use domestic linkage (SHAKTI) coal.
Appendix B: Supplementary Results
B.1 Shortfall hours distribution
Figure B1 shows the distribution of annual shortfall hours across states and weather years.
Figure 12
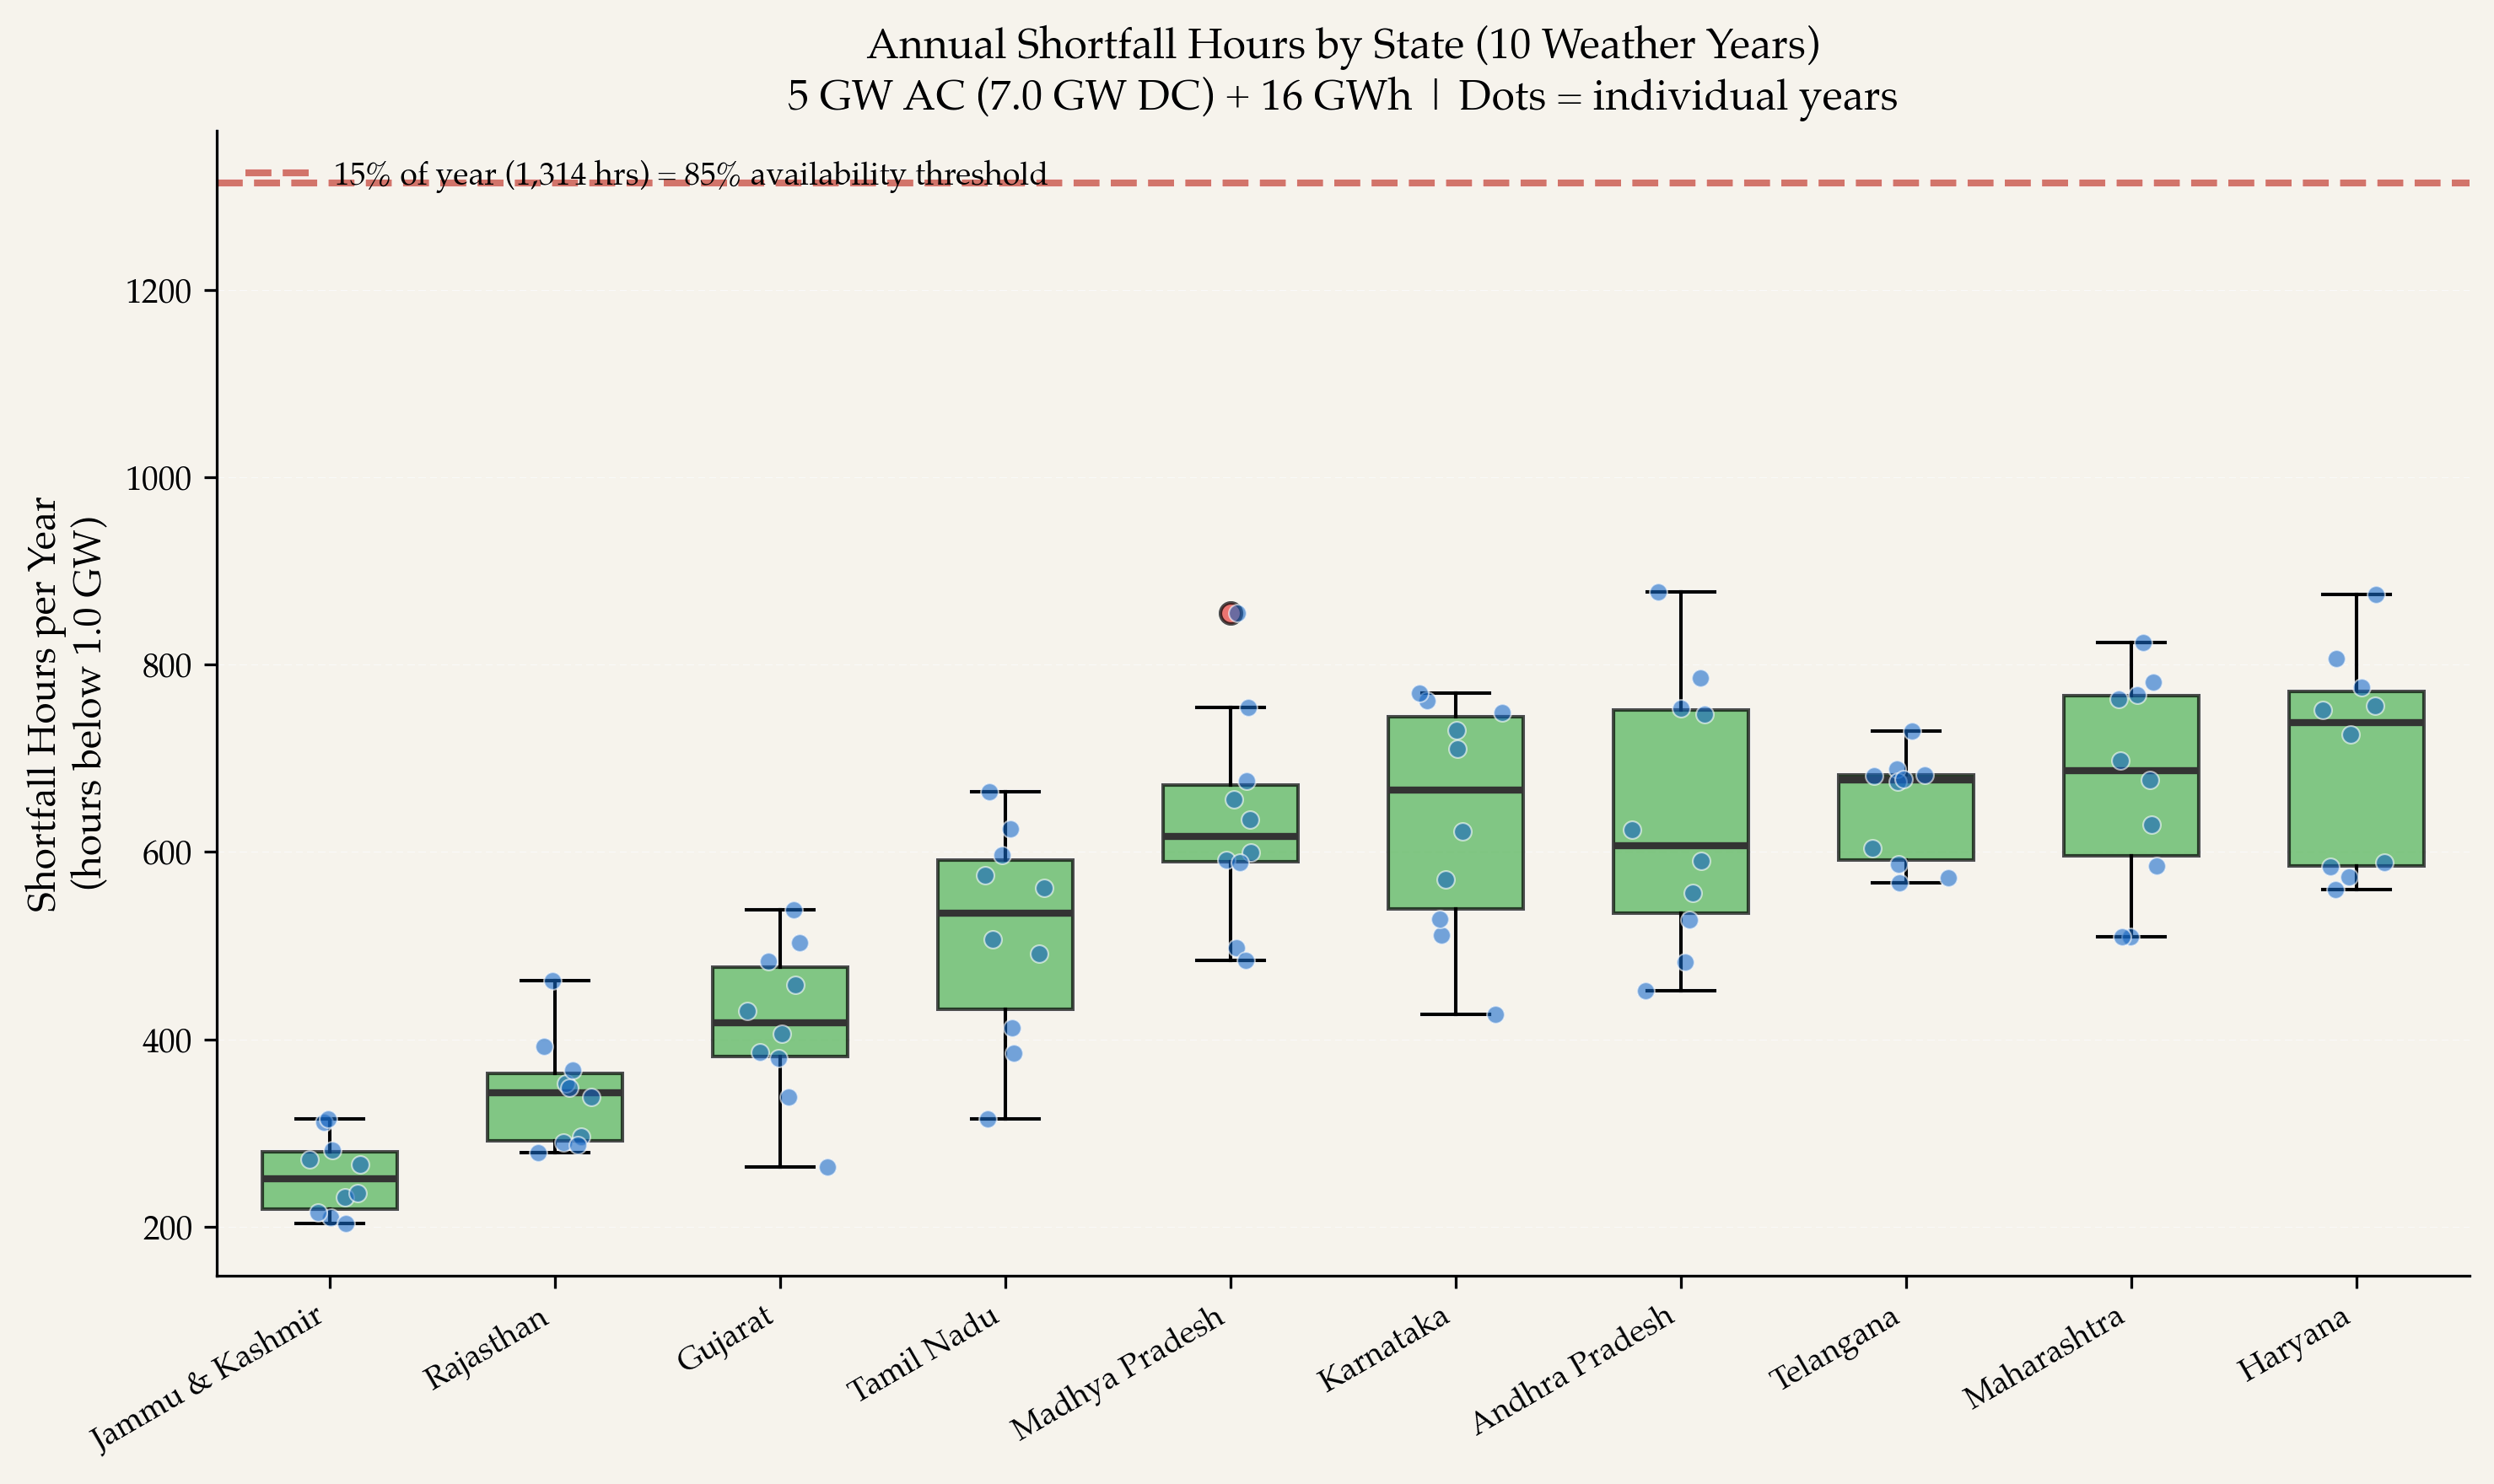
UC BERKELEY ANALYSIS · AUGUST 2026
Figure B1: Annual shortfall hours by state across 10 weather years. Dots show individual years. Red dashed line = 1,314 hours (15 percent of year), corresponding to the 85 percent availability threshold.
B.2 India’s solar resource: why round-the-clock works
The plant’s consistently high availability is a direct consequence of India’s solar resource characteristics. Unlike higher-latitude countries where winter solar production can drop to 20–30 percent of summer levels, India’s tropical and subtropical geography produces remarkably stable solar generation throughout the year.
Figure B2 shows the daily gross solar generation for a single plant across 10 states and 10 weather years.
Figure 13
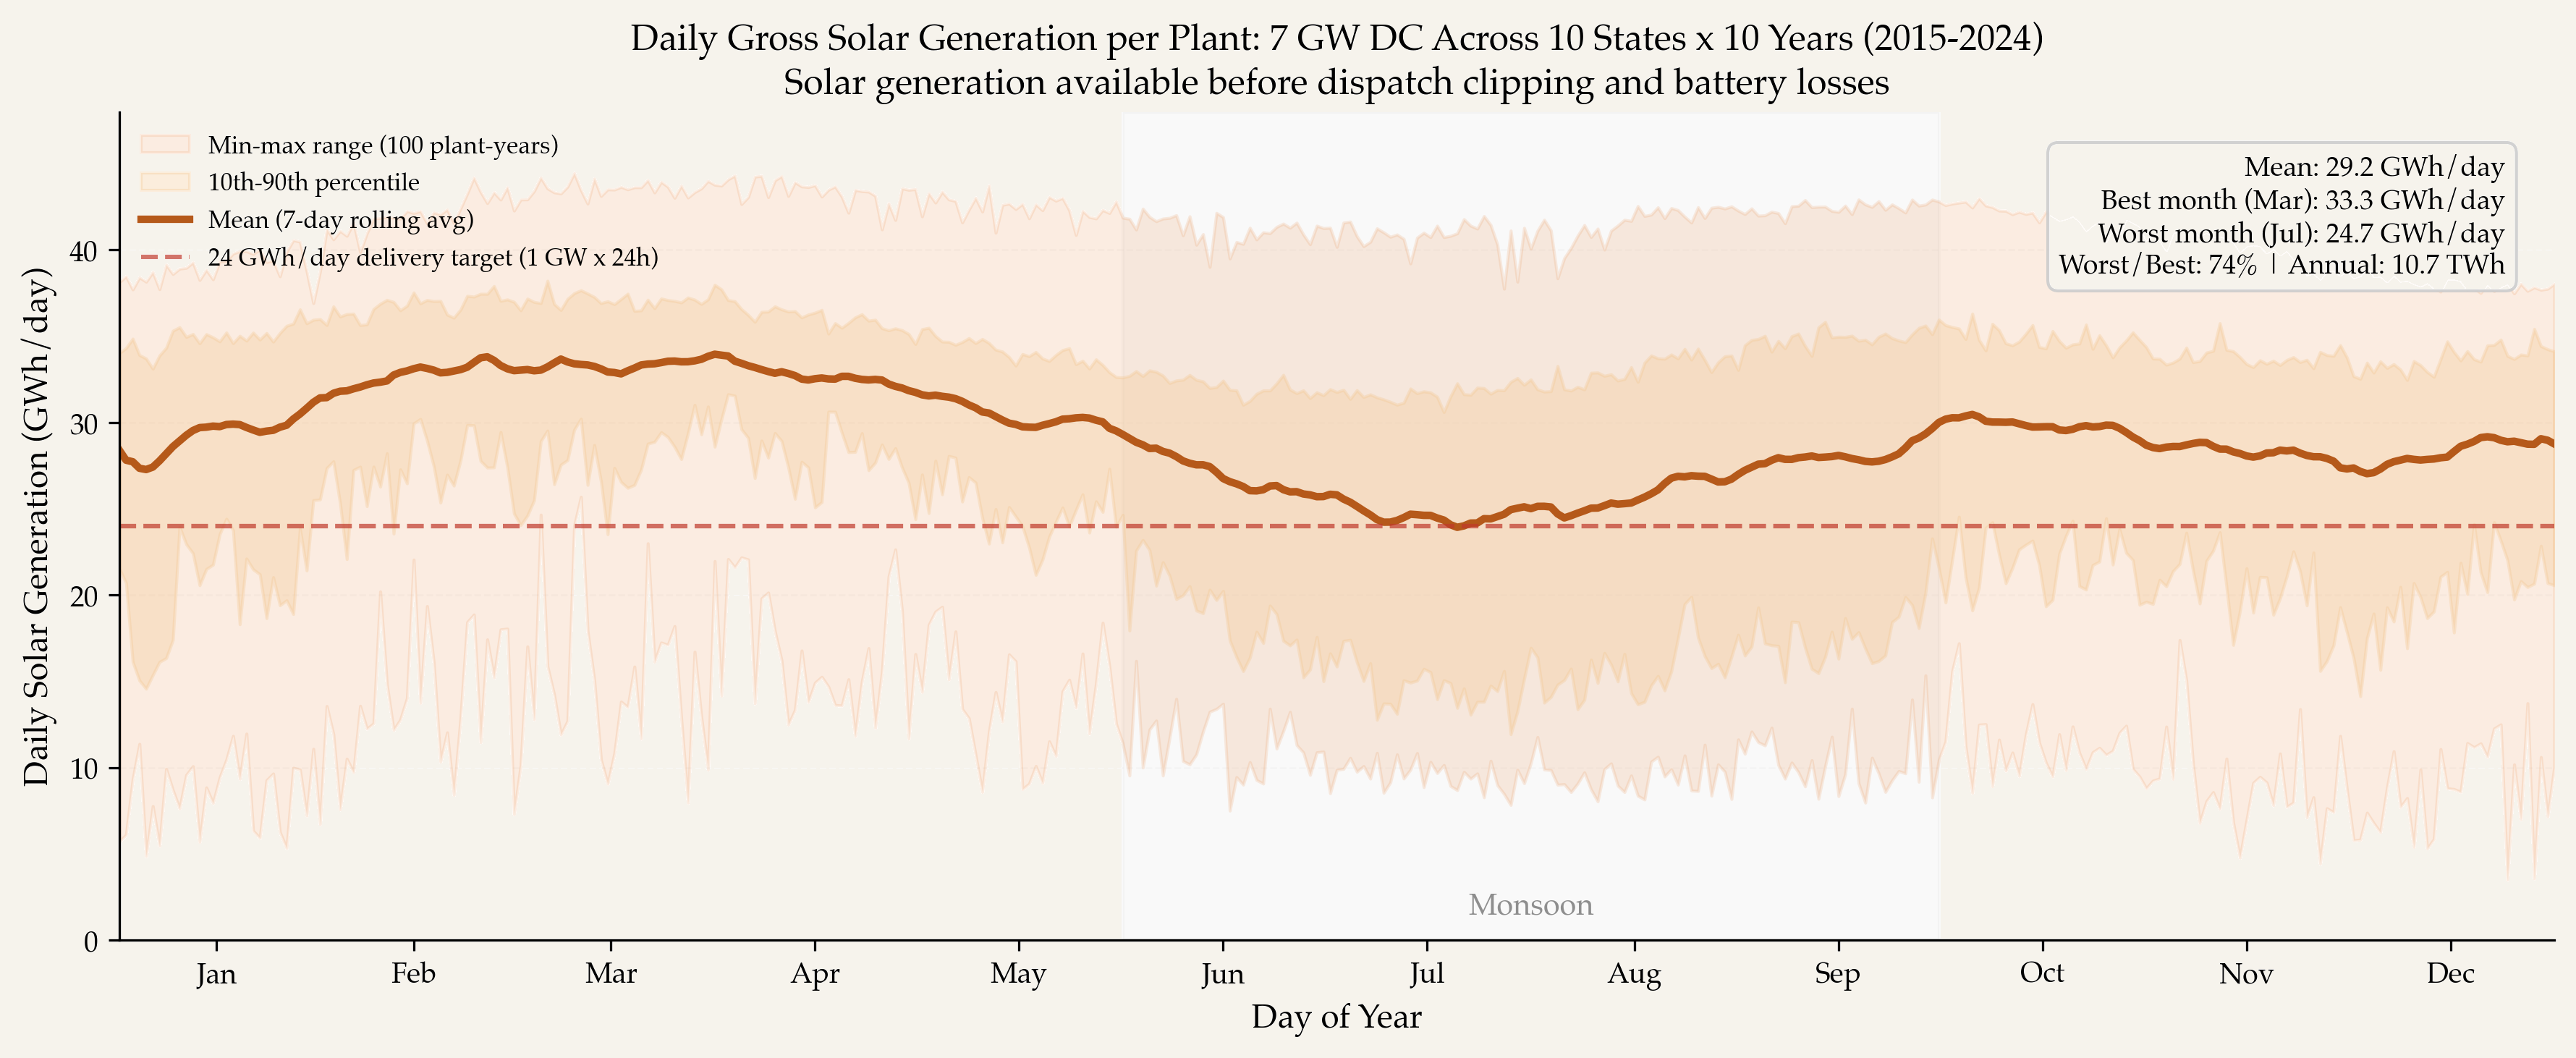
UC BERKELEY ANALYSIS · AUGUST 2026
Figure B2: Daily gross solar generation (GWh/day) from a single plant’s 7 GW DC solar array across 100 plant-year scenarios (10 states, 10 weather years). Bold line: mean (7-day rolling average). Dark band: 10th–90th percentile. Light band: full min-max range. Blue dashed line: 24 GWh/day delivery target (1 GW x 24 hours).
A single plant generates an average of 29.2 GWh/day of gross solar energy, 22 percent above the 24 GWh/day delivery target. In the best months (February–April), generation averages 33 GWh/day; in the worst month (July), it averages 24.7 GWh/day on average, still above the delivery target, and 74 percent of the March peak. Annual generation per plant averages 10.7 TWh. Even in the worst month, the mean daily solar generation exceeds what the plant needs to deliver, and the battery bridges shortfalls during individual low-solar days within that month.
This seasonal stability is a direct consequence of India’s geography. At latitudes of 10–35 degrees north, the ratio between worst-month and best-month solar generation is far tighter than in temperate climates, where seasonal swings of 3:1 or more are common.
The stability of India’s solar resource is the fundamental reason a solar-plus-storage plant can meet coal-equivalent availability norms. The battery only needs to bridge the night, not compensate for weeks of cloudy winter weather as it would in northern Europe or the northeastern United States.
Appendix C: Literature Review
This appendix situates the main analysis within the peer-reviewed and policy literature on (i) firm capacity and reliability metrics, (ii) solar-plus-storage as dispatchable generation, (iii) estimation of renewable capacity value (ELCC), and (iv) empirical performance of coal plants in India. It also references the Central Electricity Authority’s (CEA) techno-economic assessments of Renewable Energy Round-the-Clock (RE-RTC) supply configurations.
C.1. Reliability metrics and the definition of “firm” capacity
Resource adequacy is traditionally assessed using probabilistic reliability metrics such as Loss of Load Probability (LOLP) and Loss of Load Expectation (LOLE), from which Effective Load Carrying Capability (ELCC) is derived (Garver, 1966; Keane et al., 2011). ELCC measures the incremental load that can be served at constant reliability when a new resource is added.
The capacity value of wind and solar has been extensively analyzed using ELCC frameworks (Keane et al., 2011; Milligan et al., 2012; Madaeni et al., 2013). These studies consistently show that:
- Capacity credit declines with increasing penetration due to saturation effects.
- Correlation with peak demand is a primary determinant of firm contribution.
- Storage materially increases the capacity value of solar.
However, ELCC is a system-level marginal measure. It does not directly evaluate whether a specific plant can meet a deterministic availability standard analogous to thermal plant norms. In India, coal plants are governed by a Normative Annual Plant Availability Factor (NAPAF) under the Central Electricity Regulatory Commission (CERC) Tariff Regulations (CERC, 2024). NAPAF specifies the percentage of hours a plant must be available at rated capacity to recover capacity charges.
The present study departs from marginal ELCC estimation and instead evaluates whether a co-located solar-plus-storage configuration can meet coal-equivalent availability thresholds consistent with NAPAF and peak-season obligations. This regulatory comparability is directly relevant for procurement design.
C.2. Solar-plus-storage as dispatchable generation
C.2.1 Configuration and dispatch modeling
DiOrio, Denholm, and Hobbs (2020) develop a detailed modeling framework for photovoltaic (PV) plants coupled with batteries, explicitly comparing AC- and DC-coupled architectures and dispatch strategies. They show that DC coupling and inverter loading ratio (ILR) greater than unity allow recovery of clipped energy and improve dispatchability. Their results highlight that plant configuration, rather than storage alone, determines dispatch capability. The present analysis does not model this clipped-energy recovery: our solar profile is supplied already AC-clipped at the 1.4:1 ILR, so the DC-side recovery DiOrio et al. describe remains un-modeled (and conservative) upside here.
Several studies of high-renewable systems demonstrate that oversizing renewable generation combined with multi-hour storage can approximate firm output profiles (Dowling et al., 2020). However, Sepulveda et al. (2018) argue that firm low-carbon resources beyond wind, solar, and storage may be needed for deep decarbonization, highlighting the importance of demonstrating that solar-plus-storage alone can meet firm capacity standards. Importantly, many of these analyses assume perfect foresight or optimization-based dispatch, which may overstate reliability relative to operationally conservative strategies.
In contrast, the present analysis uses a rule-based, myopic dispatch algorithm to test physical feasibility under conservative operational assumptions. This choice aligns with reliability-oriented evaluation rather than revenue maximization.
C.2.2 Long-duration variability and weather sampling
High-renewable reliability is sensitive to multi-day and seasonal resource variability. Shaner et al. (2018) demonstrate that long-duration low-renewable events can drive disproportionate storage requirements in temperate regions. Dowling et al. (2020) emphasize the importance of multi-year weather sampling to capture interannual variability and long-duration scarcity periods.
India’s lower latitude and relatively moderate seasonal solar variability fundamentally distinguish it from higher-latitude regions. The CEA has explicitly recognized this in its modeling of RE-RTC portfolios (CEA, 2024), where seasonal solar output remains comparatively stable relative to winter-constrained regions such as Europe or the northeastern United States.
The present study simulates 10 historical weather years across 10 states to capture interannual and geographic variability. While multi-decadal tail-risk assessment remains a valuable extension, the weather sampling used here is consistent with or exceeds the horizon in many ELCC studies.
C.3. Estimating firm contribution: ELCC and storage capacity value
Storage materially increases solar capacity value, particularly when peak demand occurs during evening hours following high solar production (Madaeni et al., 2013; Sioshansi et al., 2014). ELCC of solar-plus-storage depends strongly on storage duration and charge availability during critical hours.
Key methodological insights from the ELCC literature include:
- Capacity credit must be evaluated probabilistically under load and outage uncertainty (Keane et al., 2011).
- Storage ELCC depends on dispatch strategy and state-of-charge management (Sioshansi et al., 2014).
- At high renewable penetration, marginal ELCC declines but does not vanish; portfolio composition and duration matter (Milligan et al., 2012).
However, ELCC studies typically do not test deterministic availability benchmarks analogous to NAPAF. Moreover, many ELCC analyses omit explicit treatment of renewable forced outage rates or treat them simplistically.
The present study integrates:
- Multi-year weather variability,
- Explicit equipment derating based on forced outage rates for solar and battery systems (Deline et al., 2024; EPA, 2023), and
- Hourly availability benchmarking against coal-equivalent thresholds.
Thus, while ELCC remains the gold standard for system-level adequacy accreditation, the approach here addresses a procurement-oriented question: whether a single plant can satisfy coal-norm availability.
C.4. CEA’s Renewable Energy Round-the-Clock (RE-RTC) assessments
The Central Electricity Authority (CEA) has conducted detailed techno-economic analyses of RE-RTC supply portfolios, evaluating combinations of solar, wind, and storage designed to provide 24x7 supply under INR 6/kWh (CEA, 2024). These assessments model multiple configurations of:
- Solar + wind mixes,
- Battery storage and pumped hydro storage,
- Regional diversity effects.
CEA’s findings demonstrate that RE-RTC portfolios are technically feasible at tariff levels competitive with new coal, particularly when combining solar and wind diversity with storage.
However, CEA’s assessments primarily operate at the portfolio and system planning level, rather than evaluating single co-located plant performance against deterministic NAPAF-equivalent thresholds. They also do not directly compare simulated renewable availability with actual coal outage behavior.
The present analysis complements CEA’s portfolio studies by:
- Testing a single co-located configuration,
- Applying coal-equivalent availability norms explicitly,
- Internalizing full transmission costs under the General Network Access (GNA) framework, and
- Benchmarking against empirical coal availability data.
C.5. Empirical reliability of coal plants in India
The reliability of Indian coal plants has been documented in official CEA data. National coal fleet Plant Availability Factor (PAF) has averaged approximately 76% in recent years, with state-sector generators averaging 75–80%, below the 85% NAPAF norm (CEA, 2024–2025). Only central-sector plants (e.g., NTPC) consistently exceed 85% availability.
Coal forced outage rates reported in international reliability databases (e.g., NERC GADS) range from 10–12%, with outage durations often extending multiple days. Indian coal plants face additional operational risks including boiler tube failures, fuel supply disruptions, and ash handling constraints.
Importantly, coal outages are stochastic and can occur during peak demand periods. By contrast, solar-plus-storage shortfalls are primarily driven by meteorological conditions, which exhibit seasonal structure and forecastability.
The present study’s comparison of simulated solar-plus-storage availability with actual CEA Daily Generation Report outage data provides a direct empirical contrast rarely undertaken in prior literature.
C.6. Methodological distinctions and contributions
Relative to existing studies, the present work contributes:
-
Coal-norm equivalence framing: Direct benchmarking against CERC NAPAF availability thresholds rather than marginal ELCC alone.
-
Single-site, co-located architecture: Eliminates dispersion and accountability concerns identified in prior RE-RTC procurement experience.
-
Conservative dispatch modeling: Myopic, rule-based dispatch without perfect foresight.
-
Explicit forced outage treatment: Equipment derating applied to both solar and storage.
-
Transmission cost internalization: Application of GNA-based transmission charges for parity with coal plants.
-
Empirical coal outage benchmarking: Direct comparison with observed coal availability.
Together, these features situate the study at the intersection of adequacy theory, storage dispatch modeling, and Indian regulatory practice.
Appendix C References
Central Electricity Authority (CEA). (2024). Techno-Economic Analysis of Renewable Energy Round the Clock (RE-RTC) Supply for Achieving India’s 500 GW Non-Fossil Fuel Based Capacity Target by 2030. Ministry of Power, Government of India. https://cea.nic.in/
DiOrio, N., Denholm, P., & Hobbs, W. B. (2020). A model for evaluating the configuration and dispatch of photovoltaic plus battery power plants. Applied Energy, 262, 114465. https://doi.org/10.1016/j.apenergy.2019.114465
Dowling, J. A., Rinaldi, K. Z., Ruggles, T. H., et al. (2020). Role of long-duration energy storage in variable renewable electricity systems. Joule, 4(9), 1907–1928. https://doi.org/10.1016/j.joule.2020.07.007
Garver, L. L. (1966). Effective load carrying capability of generating units. IEEE Transactions on Power Apparatus and Systems, 85(8), 910–919. https://doi.org/10.1109/TPAS.1966.291652
Keane, A., Milligan, M., Dent, C., et al. (2011). Capacity value of wind power. IEEE Transactions on Power Systems, 26(2), 564–572. https://doi.org/10.1109/TPWRS.2010.2062543
Madaeni, S. H., Sioshansi, R., & Denholm, P. (2013). Comparing capacity value estimation techniques for photovoltaic solar power. IEEE Journal of Photovoltaics, 3(1), 407–415. https://doi.org/10.1109/JPHOTOV.2012.2217114
Milligan, M., et al. (2012). Capacity value of wind and solar power. IEEE Power & Energy Magazine, 10(3), 43–52. https://doi.org/10.1109/MPE.2012.2190373
Sepulveda, N. A., Jenkins, J. D., de Sisternes, F. J., & Lester, R. K. (2018). The role of firm low-carbon electricity resources in deep decarbonization of power generation. Joule, 2(11), 2403–2420. https://doi.org/10.1016/j.joule.2018.08.006
Shaner, M. R., Davis, S. J., Lewis, N. S., & Caldeira, K. (2018). Geophysical constraints on the reliability of solar and wind power in the United States. Energy & Environmental Science, 11, 914–925. https://doi.org/10.1039/C7EE03029K
Sioshansi, R., Madaeni, S. H., & Denholm, P. (2014). A dynamic programming approach to estimate the capacity value of energy storage. IEEE Transactions on Power Systems, 29(1), 395–403. https://doi.org/10.1109/TPWRS.2013.2279839
Footnotes
-
Range reflects the min–max of six new coal PPAs awarded Mar–Nov 2025; plant-by-plant tariffs in Appendix A.7, Table A3. ↩
-
The INR 5.84/kWh is the arithmetic midpoint of the 5.38–6.30 range. For reference, the simple mean of the six representative PPAs in Appendix A.7 is approximately INR 5.81/kWh and the capacity-weighted mean approximately INR 5.90/kWh. ↩
-
Illustrative escalation, not produced by the cost model. The six benchmark PPAs (Appendix A.7, Table A3) decompose into a fixed capacity charge averaging INR 4.03/kWh (about 69 percent of the first-year tariff) and a variable fuel charge averaging INR 1.78/kWh (about 31 percent); all six are supplied with domestic linkage (SHAKTI) coal. Holding the fixed charge constant and escalating only the variable fuel charge at the CERC-notified rate (domestic 2.61 percent, imported 4.13 percent, inland rail transport 2.65–8.89 percent; CERC Notification No. Eco-E/2026-CERC, 16 April 2026), the INR 5.84/kWh benchmark midpoint reaches INR 6.4/kWh (domestic) to INR 6.7/kWh (imported) by year 10 and INR 7.1–8.1/kWh by year 20: 5.84 x (0.69 + 0.31 x 1.0261^t) gives INR 6.4/kWh at t=10. ↩